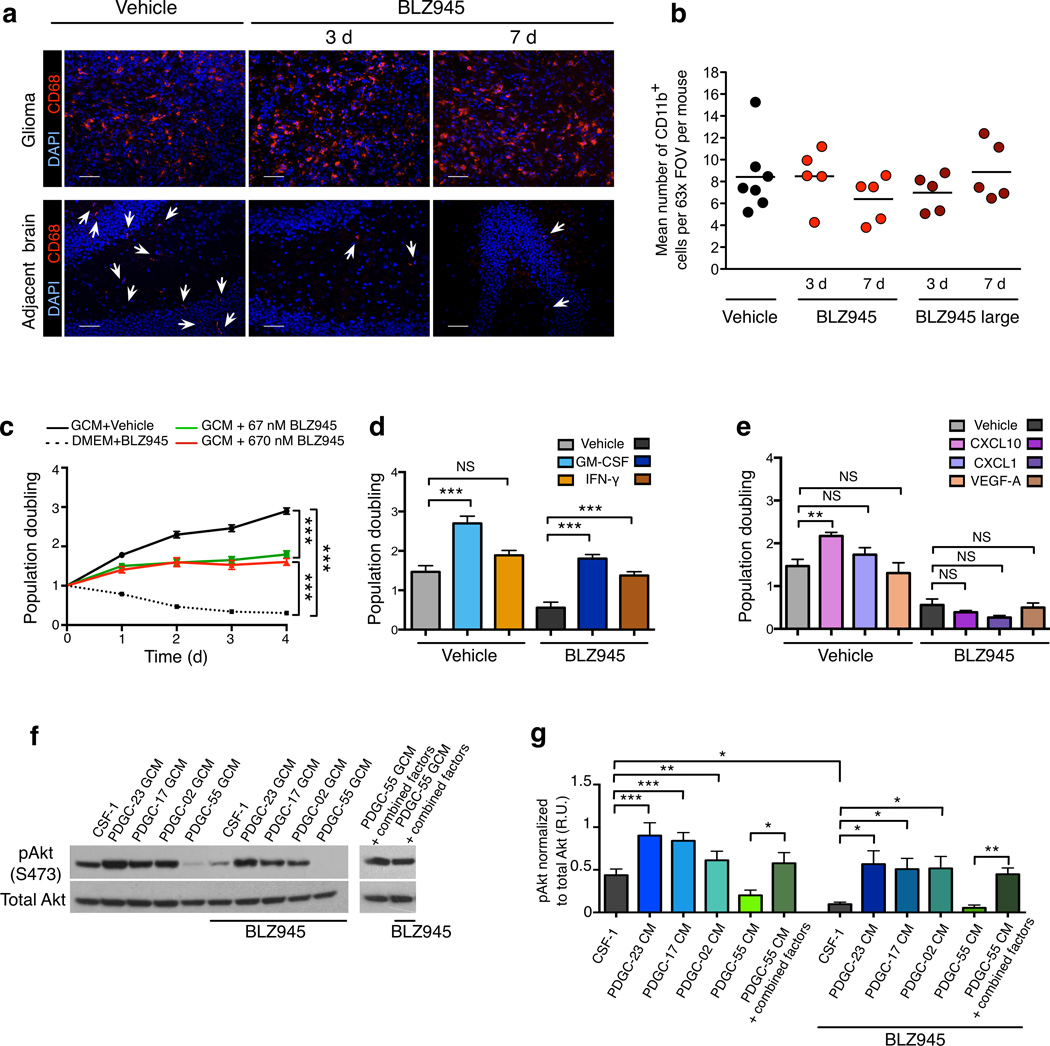
Figure 5. CSF-1R inhibition depletes normal microglia, but not TAMs in treated PDG gliomas due to the production of glioma-supplied survival factors.
(a) Representative images of PDG gliomas (upper panel) and adjacent normal brain from the contralateral hemisphere of tumor-bearing mice (lower panel) from the 7d BLZ945 trial stained for CD68 and DAPI. (b) Graph showing quantitation of the mean number of CD11b+ macrophages per 63× field of view (FOV) within each mouse tumor at 7d. (c) Graph showing MTT assays of BMDMs, demonstrating that glioma cell-conditioned media (GCM) induced BMDM proliferation and protected BMDMs from BLZ945-induced apoptosis, n = 19 independent replicates. For comparison, BMDMs were cultured in non-conditioned media supplemented with CSF-1. (d) Results compiled from MTT assays demonstrating that GM-CSF and IFN-γ individually protected BMDMs against BLZ945-induced death (n = 9 independent replicates) while (e) CXCL10 promoted proliferation (n = 6 independent replicates). These effects were not reproduced by other candidate factors, e.g. CXCL1 and VEGF-A shown here and in Supplementary Fig. 17. (f) Western blots showing activation of Akt (Ser473 phosphorylation site) in BMDMs. BMDMs were stimulated with freshly prepared GCM from protective (PDGC-23, PDGC-17, PDGC-02) or non-protective (PDGC-55) cell lines +/− BLZ945. In addition, GCM from non-protective PDGC-55 cells was supplemented with survival factors (GM-CSF, IFN-γ and CXCL10) +/− BLZ945. (g) Graph showing quantitation of phosphorylated Akt (pAkt), normalized to total Akt, demonstrating significant changes in pAkt levels between BMDMs stimulated with the protective or non-protective GCM +/− BLZ945. n = 4 independent replicates. BLZ945 was used at 670 nM in all cell culture assays unless otherwise specified. Circles in graph (b) represent individual mice (n ≥ 5 per group), and horizontal lines represent the mean. Data in other graphs represent mean and s.e.m. P values were obtained using unpaired two-tailed Student’s t-test; NS = not significant, *P<0.05, **P<0.01, ***P<0.001. There were no significant differences for any comparisons in (b).

