
Fig. 5.
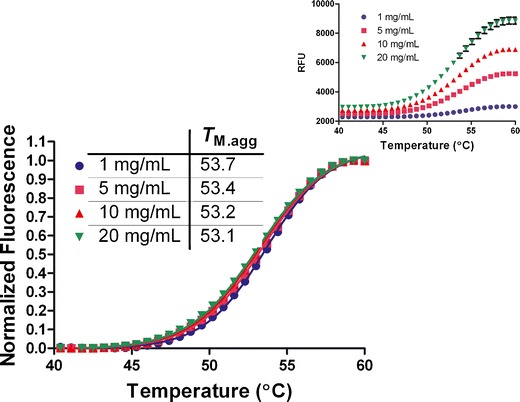
Thermal scanning of MDP (1 mg/mL) at different protein concentrations in the presence of ThT. The relative fluorescence units (RFU; inset) at each concentration was normalized and fit to Eq. 1 to obtain the mid-point of the thermal transitions. Inset shows the plot of the fluorescence intensity change as a function of temperature, and the error bars in black are the SD of the quadruplicate runs. The SD in T M.agg measurement at each protein concentration in this case was ≤ 0.1°C