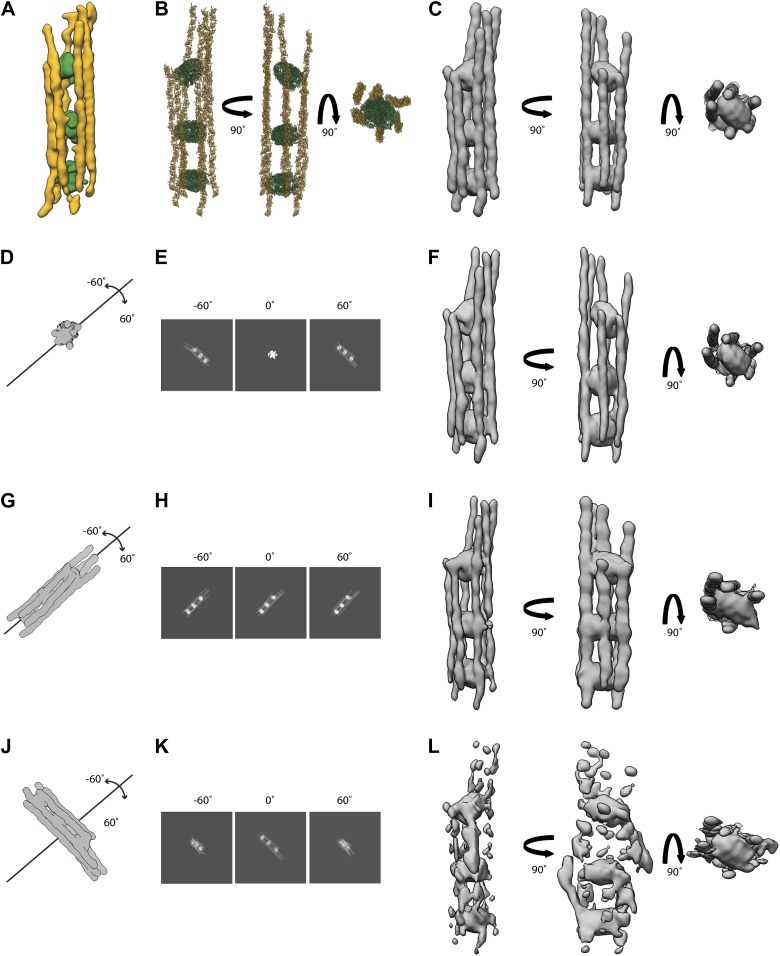
Figure 20. Simulations of electron tomograms of septin-Gic1-Cdc42-GppNHp complexes.
(A) Side view of a septin-Gic1-Cdc42-GppNHp subtomogram. The septin filaments and Gic1-Cdc42-GppNHp cross-bridges are depicted in gold and green, respectively. (B) Model of a septin-Gic1-Cdc42-GppNHp complex obtained by fitting the crystal structure of the mammalian septin trimer (PDBid: 2QAG, gold) and GROEL/GROES (PDBid: 1AON, green) into (A), shown in three different orientations. (C) Simulated EM density map of (B) at a resolution of 45 Å. (G–L) Simulations of electron tomograms obtained by tilting the model shown in (C) in the range of ±60 in 2° increments with its long axis running parallel to the beam (D), parallel (G) and perpendicular (J) to our microscope’s tilt axis, respectively. (E, H, and K) Corresponding projections at −60°, 0°, 60° and (F, I, and L) the resulting simulated tomograms, respectively. Note that the tomograms shown in (I and L) are obviously affected by missing wedge artifacts, whereas the tomogram in (F) (long axis of the molecule parallel to the beam axis during tilting) is only slightly stretched in comparison to the original model (C).

