. 2013 Dec 3;2:e01179. doi: 10.7554/eLife.01179

Figure 2. 5’ UTRs are translated.

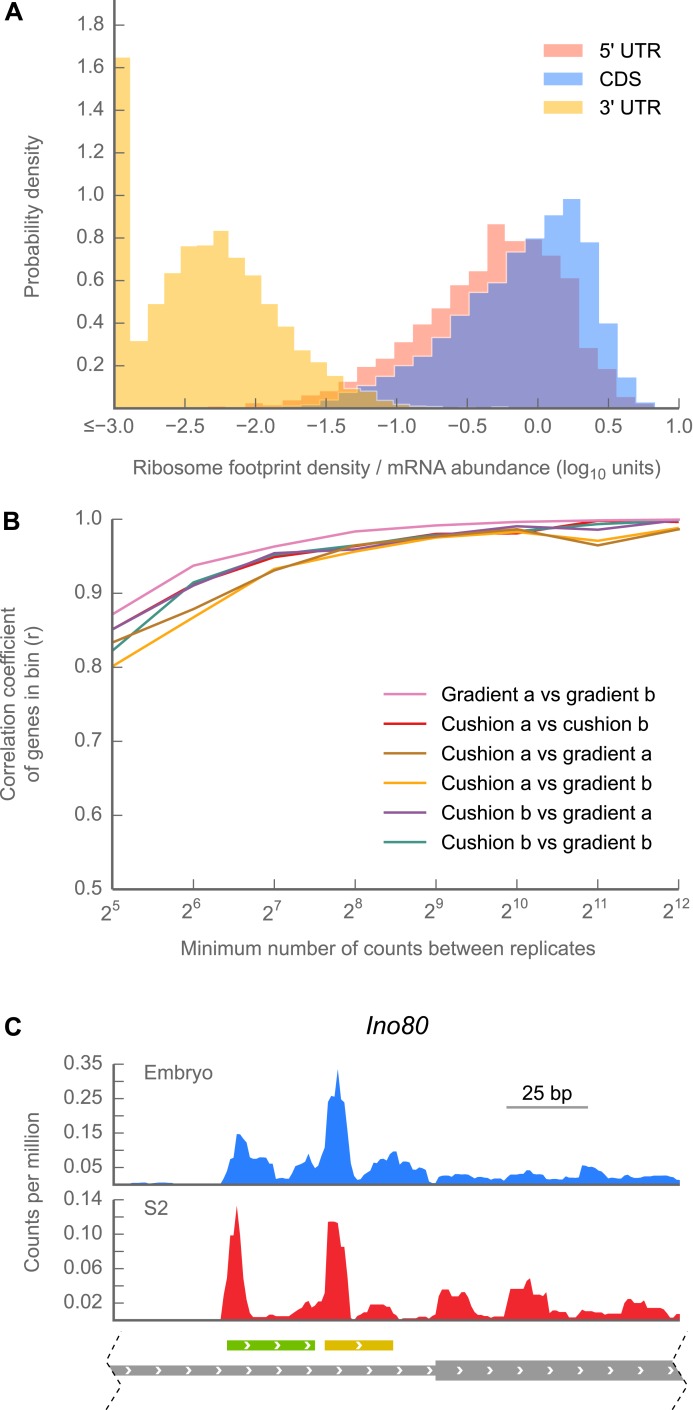
(A) Histograms of ribosome footprint density, corrected by mRNA abundance, for 5’ UTRs, coding regions (CDS), and 3’ UTRs in 0–2 hr embryos. (B) Measurements of ribosome footprint densities of 5’ UTRs agree comparably well across a range of sequencing depths, regardless of whether 80S monosomes are specifically isolated on a sucrose gradient or enriched in a cushion. For each pair of sequencing samples, Pearson correlation coefficients (r) of ribosome footprint density measurements for 5’ UTRs are plotted as a function of sequencing depth. (C) Example of ribosome density in 5’ UTRs corresponding to the locations of uORFs. Roughly ∼200 nt of the genomic locus Ino80 covering portions of the 5’ UTR (thin gray box) and CDS (thick gray box) are shown. In both 0–2 hr embryos and S2 cells, Initiation peaks are visible at the starts of uORFs starting with an ATG codon (green box) and a near-cognate TTG codon (yellow box) as well as at the annotated start codon (beginning of thick gray box). Source data for panels (A) and (B) may be found in supplementary table 1 (at Dryad: Dunn et al., 2013).

DOI: http://dx.doi.org/10.7554/eLife.01179.008

Figure 2.

Figure 2—figure supplement 1. Ribosome density over start and stop codons.

Figure 2—figure supplement 1.

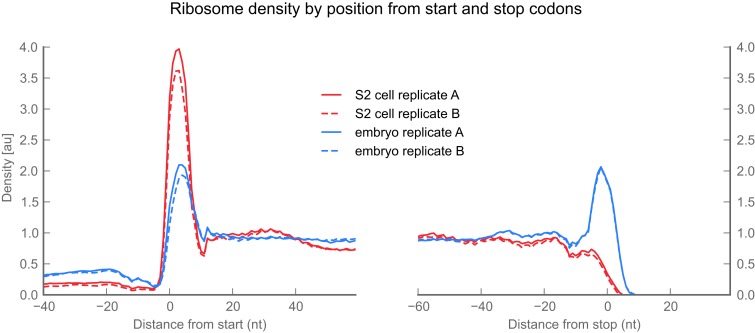
Ribosome density across the average gene or ‘metagene’ reveals peaks of ribosome density at start and stop codons. For this analysis we included all genes that met the following criteria: (a) all transcripts deriving from that gene had one annotated start codon (left panel) or stop codon (right panel), (b) all transcripts deriving from that locus covered identical genomic positions over the region of interest (ROI) shown, (c) all positions within the ROI were non-degenerate (‘Materials and methods’), and (d) at least 10 reads were present in the coding subregion of the ROI. For each ROI meeting these criteria (2800–3200 ROI per sample), we generated a ‘coverage vector’ tallying ribosome density at each nucleotide position. We then normalized each coverage vector to the mean number of footprint reads covering the annotated coding region in the ROI, excluding a 3-codon buffer flanking the start or stop codon to avoid bleedthrough from initiation or termination peaks. We then plotted the median value across all normalized coverage vectors at each position. Peaks are visible in the start and stop codons of embryo samples. Consistent with our previous work, stop codon peaks are missing from S2 cell samples because terminating ribosomes release during our 2-min treatment with translation inhibitors. They are present in our embryo samples, because these are flash-frozen and lysed in the presence of translation inhibitors, which block termination as well as initiation and elongation.
Figure 2—figure supplement 2. Read lengths are similar in 5’ UTRs and coding regions.

Figure 2—figure supplement 2.

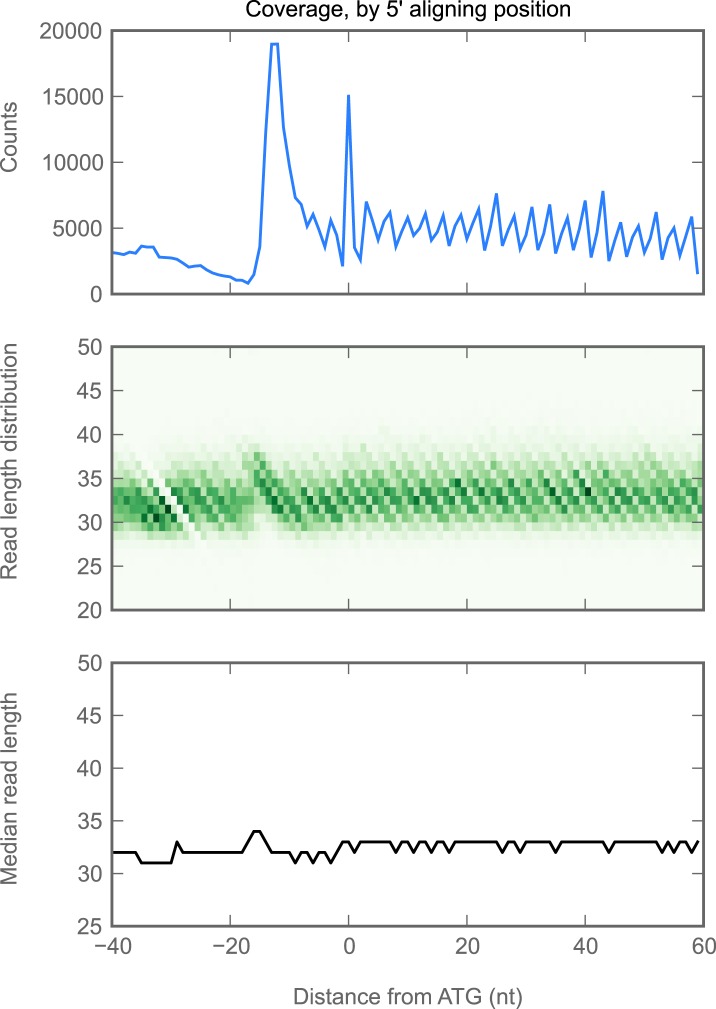
We aggregated all ribosome-protected reads aligning to all genes with a single initiation codon, and in which all annotated isoforms cover the same genomic positions in the ROI shown. We plotted the following statistics as a function of the reads whose 5' end mapped to each position on the x-axis. Top: number of reads (y-axis) aligning at each position. Because the 5' end, rather than the P-site, is plotted, the peak of ribosome density is approximately 13 nucleotides 5' of the start codon (position 0, x-axis). Middle: heatmap of read lengths (y-axis) as a function of position. Bottom: median read length (y-axis) at each position.
Figure 2—figure supplement 3. The choice of monosome enrichment technique—sedimentation through sucrose cushions or by fractionation on sucrose gradients—minimally affects of ribosome density across 5’ UTRs and coding regions. 3’ UTR measurements are noisier in samples prepared on cushions rather than gradients.

Figure 2—figure supplement 3.

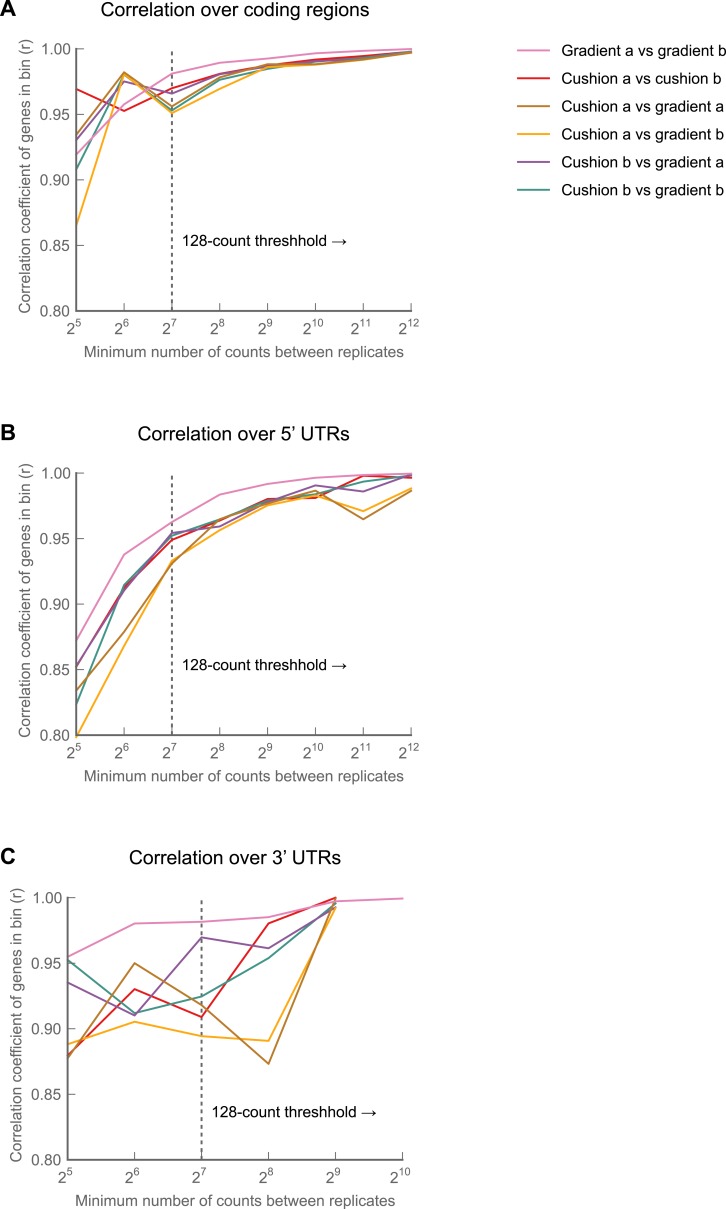
A polysome lysate was made from collected 0–2 hr embryos, digested with MNase, and split into four aliquots. Monosomes from two aliquots were sedimented through a sucrose cushion and recovered. Monosomes from the remaining two aliquots were fractionated on 10–50% sucrose gradients and collected. All four samples were then independently carried through our protocol, and footprint density was calculated over coding regions, 5' UTRs, and 3' UTRs. Pairwise comparisons were made for each sample as in Figure 1—figure supplement 2 over coding regions (A), 5' UTRs (B), or 3' UTRs (C). Pearson correlations (r) for the regions are plotted as a function of sequencing depth. Source data may be found in supplementary table 1 (at Dryad: Dunn et al., 2013).