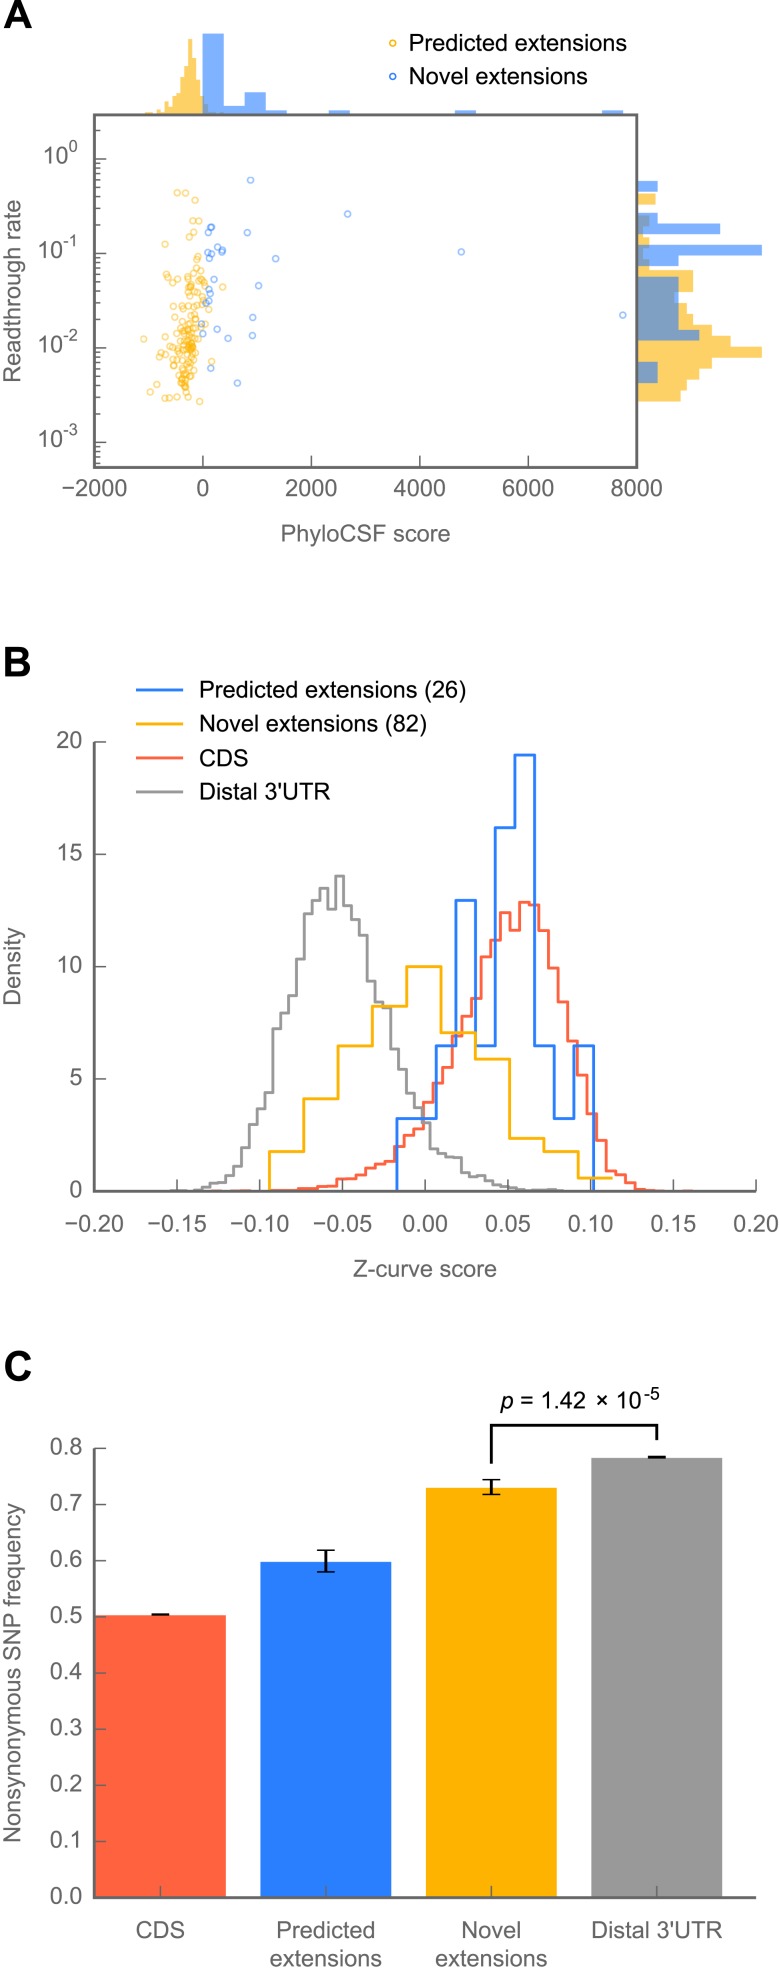
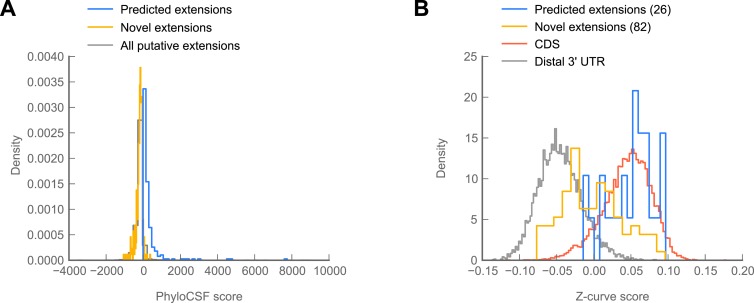
Figure 6. Novel C-terminal extensions in Drosophila melanogaster show signatures of selection within the melanogaster lineage.
(A) Scatter plot comparing readthrough rates for confirmed extensions against PhyloCSF scores. Blue: predicted extensions. Yellow: novel extensions. Datapoints with unreliably measured PhyloCSF scores or readthrough rates are not shown (‘Materials and methods’). (B) Z-curve classifier suggests that novel extensions have a nucleotide character intermediate between distal 3’ UTRs and coding regions. Histograms of Z-curve scores for 81-nucleotide windows drawn from annotated coding regions (CDS), distal 3’ UTRs, predicted extensions, and novel extensions. A single window was selected from each region 81 or more nucleotides long. Shorter regions were excluded from analysis, as they were empirically found to be noisy during classifier training. The Z-curve classifier was trained on windows drawn from CDS and distal 3’ UTRs as described in ‘Materials and methods’. (C) Novel extensions accumulate SNPs with a stronger preference than distal 3’ UTRs. Proportion of SNPs in CDS, predicted extensions, novel extensions, and distal 3’ UTRs which would be nonsynonymous if translated in frame. SNPs were obtained from wild isolates of wild-type flies by the Drosophila Population Genomics Project, and were downloaded from Ensembl (Flicek et al., 2013). Source data may be found in supplementary table 2 (at Dryad: Dunn et al., 2013).


