Figure 1.
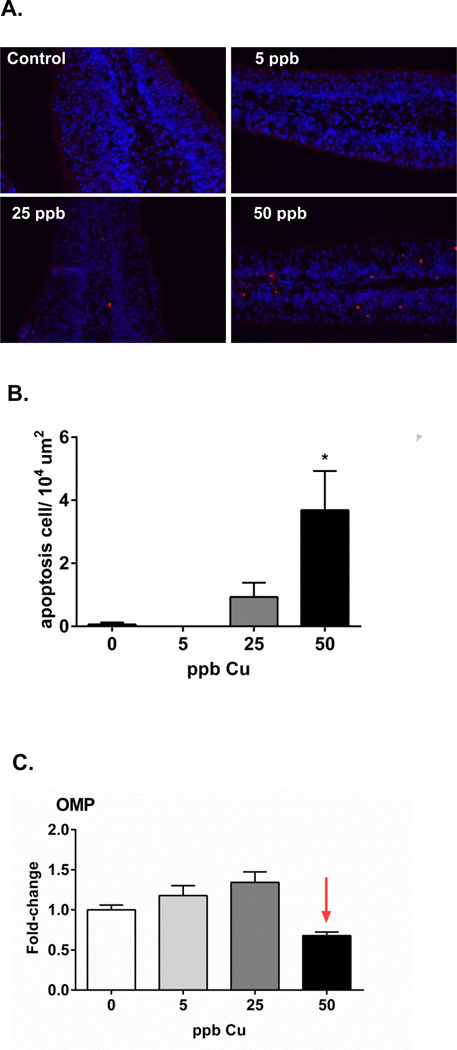
(A) TUNEL staining of coho olfactory rosette cyrosections. Apoptotic cells stained red, whereas Hoechst 33342 was used for blue nuclear counterstaining (scale bar=50 µm). (B) Graph shows the quantification of the positive TUNEL signal per 104 m2 (n=4 individuals). Asterisks indicate statistically significant difference compared to control animals not receiving Cu (ANOVA, * p < 0.05). (C) Graphs are presented as fold-change of omp mRNA expression relative to the corresponding controls, with the 5, 25, and 50 ppb Cu datasets represented by light green, light grey, and dark bars, respectively. Data represent the mean ± SEM of n=6 individuals.

