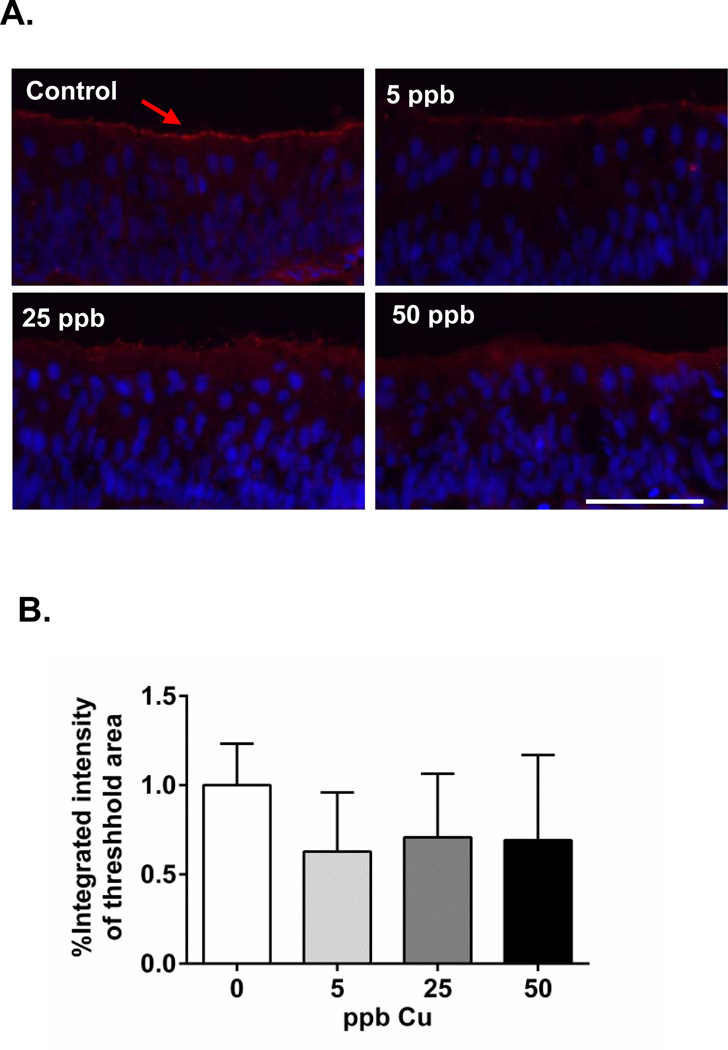
Figure 2.
(A) Immunohistochemical analysis of ACIII expression on coho olfactory rosette cryosections (arrow, red; scale bar=50 µm). Hoechst 33342 was used as a nuclear counterstain (blue). (B) Graph shows the percentage integrated intensity of threshold area relative to controls (n=4 individuals). The mean fluorescence intensity at, or above, the threshold value was measured for each image, and the calculated mean intensities for each treated group were converted to a percentage of control values.

