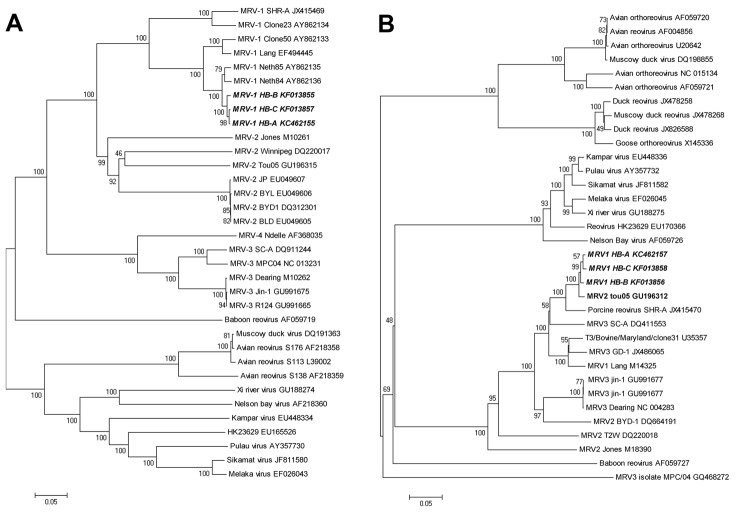
Figure 2.
Phylogenetic tree and network based on the nucleotide sequences of the small (S)1 and S3 segments of orthoreoviruses. A and B) Neighbor-joining tree of multiple orthoreovirus species. Numbers at nodes indicate bootstrap values based on 1,000 replicates. Scale bar indicates nucleotide substitutions per site. A) S1 segment; B) S3 segment. C and D) Bayesian phylogenetic tree of multiple orthoreovirus species. Numbers close to branches correspond to posterior probabilities. Branch lengths are proportional to the number of nucleotide substitutions. Scale bar indicates substitutions per aligned position. C) S1 segment; D) S3 segment. D and F) Phylogenetic network of multiple orthoreovirus species. The Neighbor-Net graph was computed by using the SplitsTree 4.13.1 software (http://ab.inf.uni-tuebingen.de/data/software/splitstree4/download/welcome.html). E) S1 segment ; F) S3 segment. MRV, mammalian orthoreovirus. Strains sequenced in this study are indicated in boldface italics.

