
Figure 5.
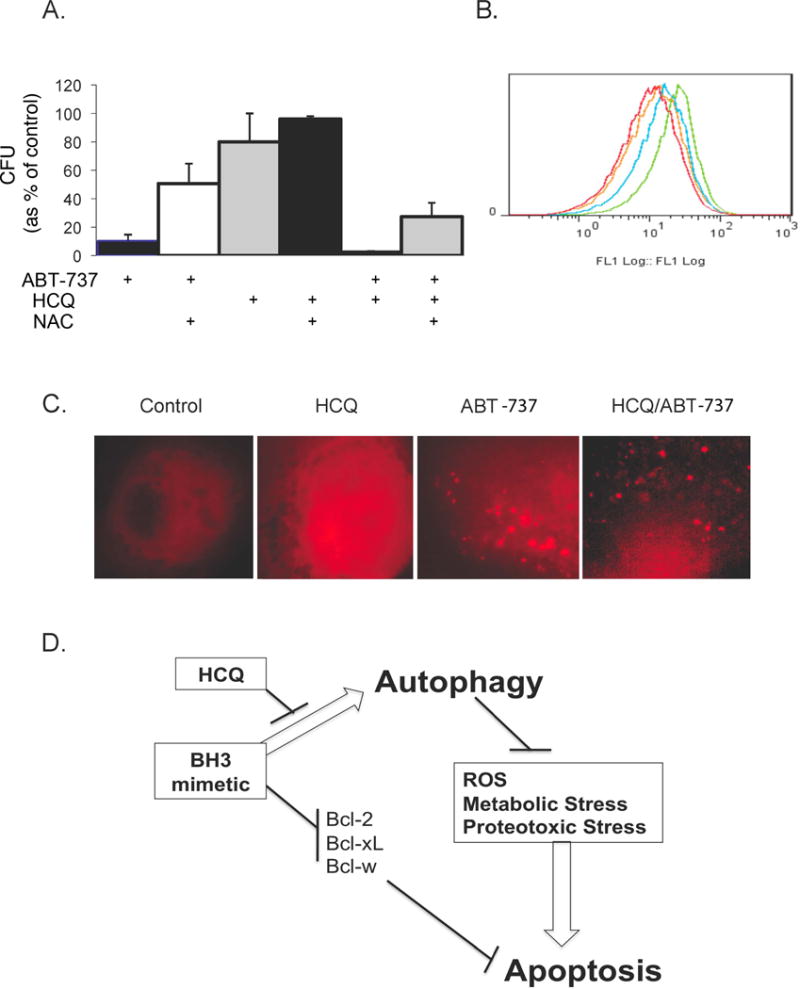
Effect of ABT-737 and HCQ on ROS and mitochondrial function. 5A: PC-3 cells were treated with 10uM of ABT-737 alone and in combination with 1mM N-acetylcysteine (first and second bars on the left) and assessed by clonogenic assay; treated with HCQ alone and in combination with N-acetylcysteine (middle two bars); or treated with the combination of both ABT-737 and HCQ with and without N-acetylcysteine (last two bars on right of figure 5A). 5B: ROS levels were determined using 10uM 2′-7′-dichlorodihydrofluorescene diacetate (DCF-DA, Molecular Probes) in cells treated with the combination of ABT-737 and HCQ (green), ABT-737 (blue), HCQ (yellow), or untreated control (red). 5C: mCherry-Parkin expressing PC-3 cells treated with 20uM of HCQ, 10uM of ABT-737 or the combination of ABT-737 and HCQ to identify dysfunctional mitochondria. 5D: a depiction of autophagy as a cell survival and resistance mechanism through abrogation of oxidative (ROS), metabolic and proteotoxic stress. Figure 5D shows a potential paradigm of optimal tumor targeting by dual inhibition of apoptosis and autophagy.