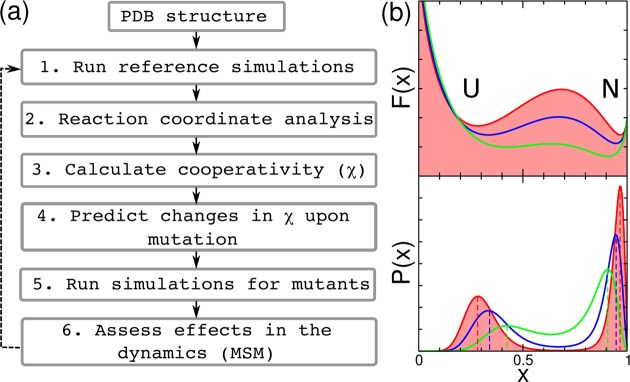
Figure 1.

(a) Flowchart with the steps involved in the protein engineering method. (b) Theoretical free energy surfaces (top) and probability distributions (bottom) as a function of an order parameter x under midpoint conditions. We show illustrative examples corresponding to the shift from bimodal (two-state, red) to downhill (green) folding. U and N are the unfolded and native states respectively, and the dashed lines mark the mean values ⟨x⟩U/N of the order parameter for the unfolded and native states.
