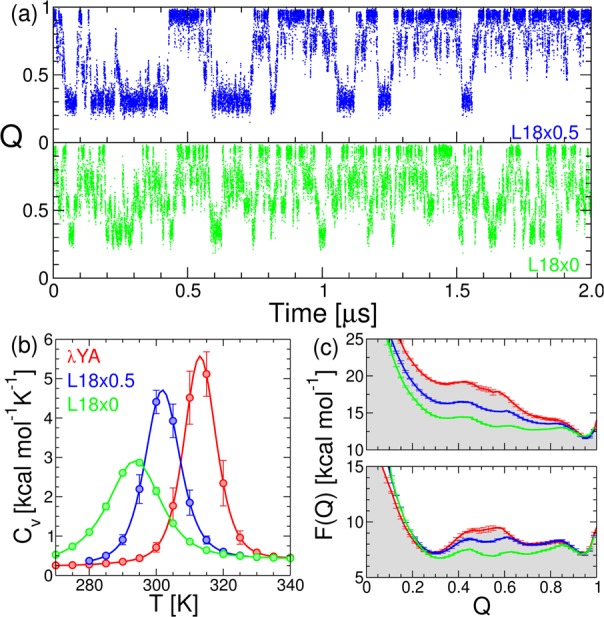
Figure 5.

Time series for the projection of the simulation trajectory for the λYA mutants L18×0.5 (blue) and L18×0 (green) on the fraction of native contacts (Q) at their midpoint temperatures. (b) Heat capacity thermograms calculated from WHAM for the mutants. (c) Potentials of mean force under native (top) and midpoint (bottom) conditions. We show the results for the WT (red) for reference.
