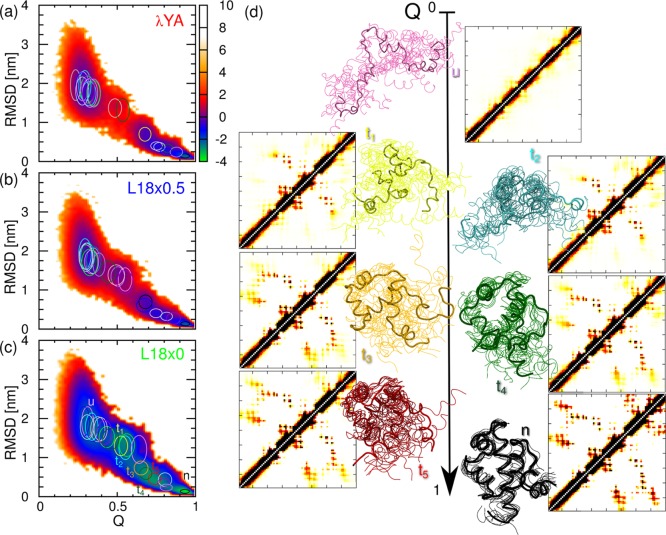
Figure 6.
Potentials of mean force (in kcal/mol) for Q and the RMSD to native for the different models for λ-repressor: λYA (a), L18×0.5 (b), and L18×0 (c). In each case, we overlay ellipsoids centered at the average RMSD and Q values for the cluster with principal axes of one standard deviation. (d) Snapshots and average contact maps for the seven most populated clusters for the L18×0 model, with the same color code and names as those in panel c.

