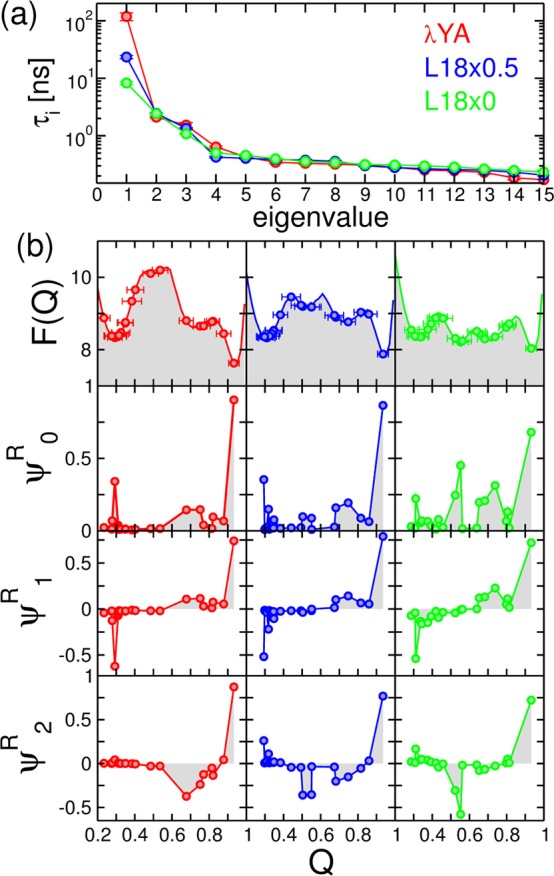
Figure 7.

(a) Spectrum of relaxation times for the MSM of the λ-repressor model and the L18 mutants. (b) Top row shows potentials of mean force (in kcal/mol) with overlaid circles indicating the mean values of Q for the different microstates of the MSM. Error bars indicate one standard deviation. The next three rows show the values of the slowest right eigenvectors ψiR projected on Q. Shaded areas are shown to illustrate the sign structure of the eigenvectors.
