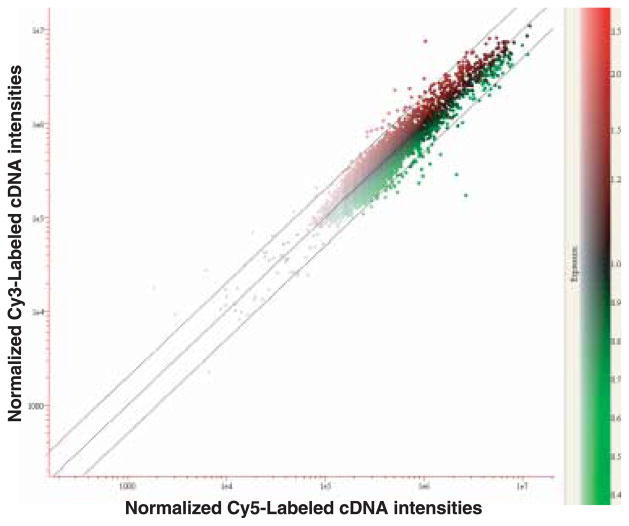
Figure 1.
Scatterplot analysis of variation in gene expression. The RNA from the non-infected was labelled with Cy5 and the ONNV-infected with Cy3. Red and green spots represent up- and down-regulated gene expression in ONNV-infective compared to non-infected control mosquitoes, respectively. The middle diagonal line indicates one-fold (no change) and the upper and lower diagonal lines show either two-fold up- or down-regulated gene expression, respectively. The x- and y-axes are in logarithmic scales.

