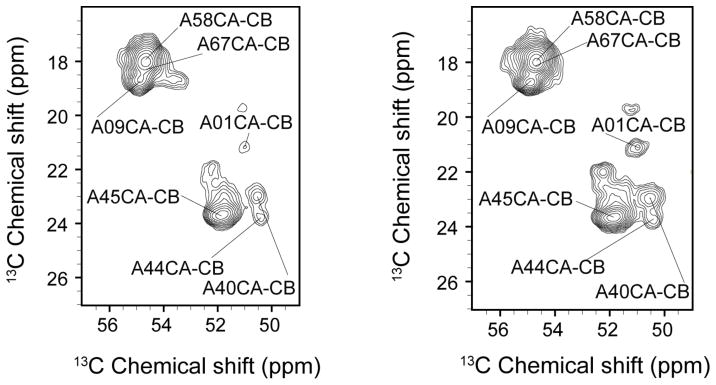
Fig. 6.

CA-CB correlations in the alanine region observed at 750 MHz 1H Larmor frequency and 3°C, using 2 ms of RFDR mixing (left) or 10 ms of DARR mixing (right). Although the two methods differ in polarization transfer characteristics and not all of the peaks have been assigned (see text), the two spectra taken together do not make a case for more than 14 distinct alanine signals.
