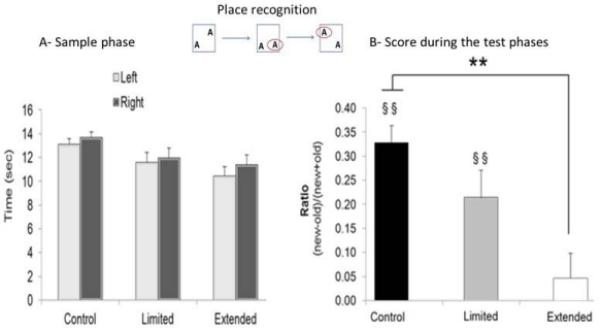
Fig. 6.

For each group: control (n = 20), limited-access (n = 12) and extended-access (n = 15) groups, (A) represents the average time spent exploring objects by location in each group during the Sample phase. (B) Average score discrimination expressed as a ratio by group during the Test phase: (time spent exploring the novel place − time spent exploring the familiar place)/(time spent exploring the novel place + time spent exploring the familiar place). The control and limited-access groups performed above zero (ratio = 0 indicates no place discrimination; §§P < 0.005), and both were significantly different from the extended-access group (**P < 0.005). The data are expressed as mean ± SEM.
