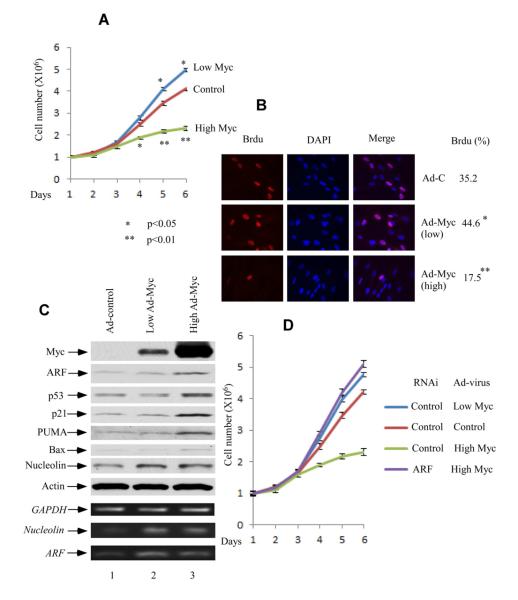
Figure 1. Different Levels of c-Myc Overexpression Have Opposite Cellular Growth Effects Dependent on ARF.
(A) Growth curve of NHF-1 cells. The NHF-1 cells were infected with low (Ad-Myc MOI 10 plus control virus MOI 40) and high levels of Adenoviral-Myc (MOI 50) versus control virus (MOI 50) for 36 hrs, and replated in normal medium (day 1). Error bars represent s.d. (n=3).
(B) The BrdU incorporation of the NHF-1 cells treated with low and high levels of Adenoviral-Myc versus control virus.
(C) Western blot analysis of cell extracts from NHF-1 cells infected with different levels of Ad-MYC (lane 3 versus lane 2) as well as control adenovirus (lanes 1) by anti-Myc, ARF, p53, p21, nucleolin, PUMA and Bax antibodies. ARF, nucleolin and GAPDH mRNA expression levels by RT-PCR were shown at lower panels.
(D) Growth curve of NHF-1 cells treated with ARF RNAi vesus control RNAi. The RNAi-treated NHF-1 cells were infected with high levels of Adenoviral-Myc (MOI 50) versus control virus (MOI 50) for 36 hrs, and replated in normal medium (day 1). Error bars represent s.d. (n=3). See also Figure S1.

