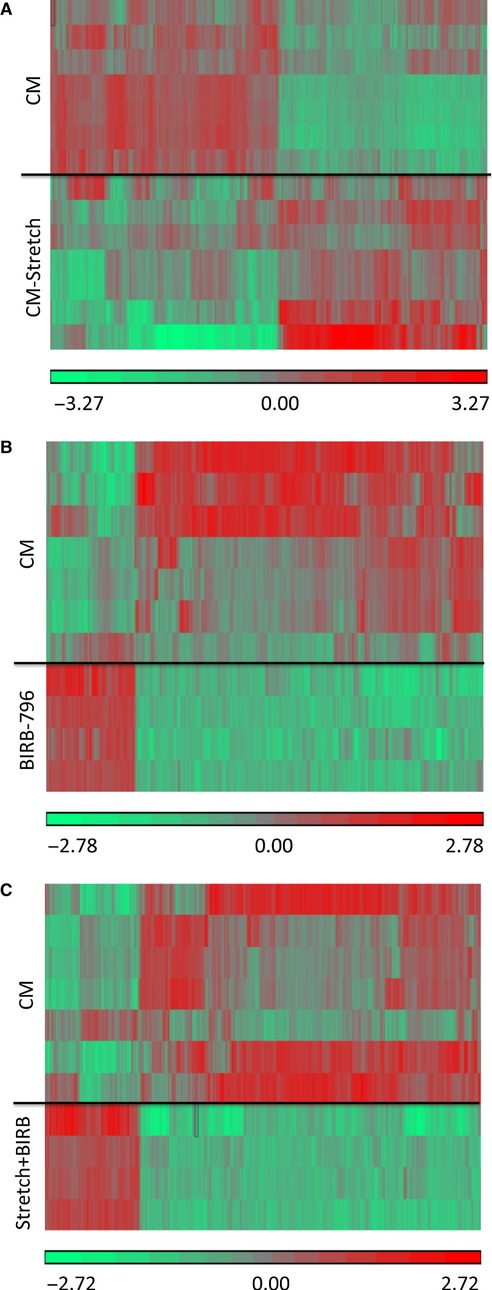
Figure 2.

Hierarchical clustering of differentially expressed transcripts in engineered cardiac tissues. Each row represents an individual sample and each band represents a single transcript (control n = 7, stretch n = 7, BIRB n = 4, and stretch+BIRB n = 4). The change in gene expression is represented by the color range. (A) Control specimens compared to specimens exposed to 48 h of cyclic stretch. (B) Control specimens compared to specimens exposed to 48 h of BIRB796. (C) Control specimens compared to specimens exposed to 48 h of cyclic stretch and BIRB796. (P ≤ 0.05, fold change ≥1.5, normalized intensity).
