
Figure 2.
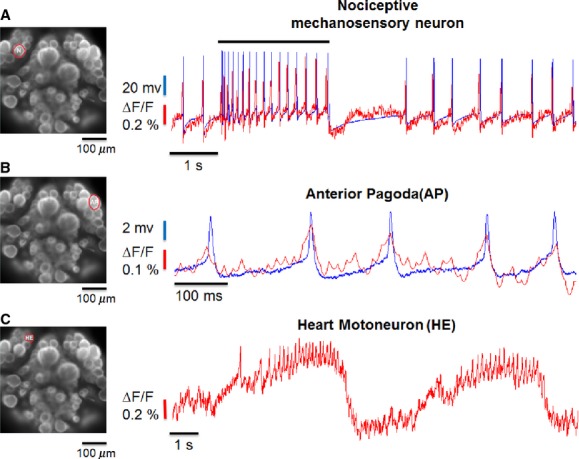
Comparison of optical (red) and electrical (blue) recordings and optical recordings from the heart motoneuron (HE). (A) Simultaneous recordings from the mechanosensory neuron encircled in red in the panel on the left. Images acquired at 100 Hz. Optical and electrical recordings have the same time course, but the peak of the spike of the mechanosensory neuron has a variable amplitude because of the limited sampling rate of image acquisition. Optical recordings follow very precisely the undershoot of about 10 mV following the spike. (B) as in A, but during an electrical recording from the Anterior Pagoda (AP) neuron encircled in the panel on the left. The amplitude of spike of AP neurons, recorded in the soma, is ∼4 mV and is clearly recorded also during the optical recording. (C) Optical recording from the Heart Motoneuron encircled in the panel on the left. The optical recording exhibits an oscillatory behavior with a period of 5–10 sec typical of these neurons (Kristan et al.2005) during which the membrane potential changes by about 10 mV.