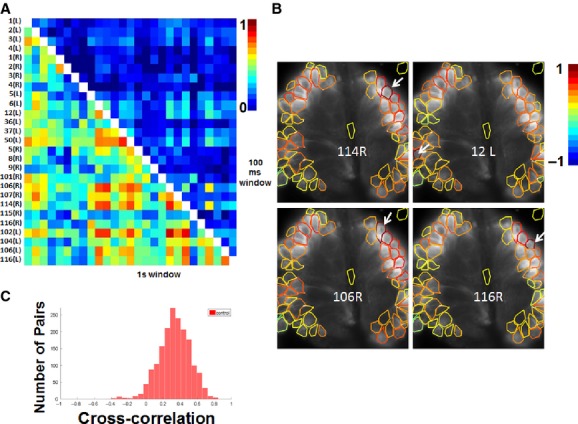
Figure 6.

Correlation structure of electrical activity of neurons visible in the dorsal surface of the ganglion. (A) The cross-correlation  of the firing of neuron i and neuron j computed within a size window of 100 and 1000 msec. Entries of
  vary between 0 and 1 according to the color-coded scale shown on the right of the panel, with a window of 100 msec
  was rarely larger than 0.5 (2/351) and the window of 1 sec was occasionally larger than 0.5 (97/351). (B) Spatial profile of
  among motoneurons visible in the dorsal surface. In each panel the motoneuron indicated at the center was taken as the reference neuron i and
  was computed for all the other visible neurons j. The profile of the reference neuron i is indicated in dark red, all the other neurons are circled with a colored line indicating the degree of cross-correlation of the graded activity measured by
  using the color-coded scale at the right of the panel. (C) distribution of values of
  measured from neurons visible in the dorsal surface of the ganglion. Data from three experiments.
