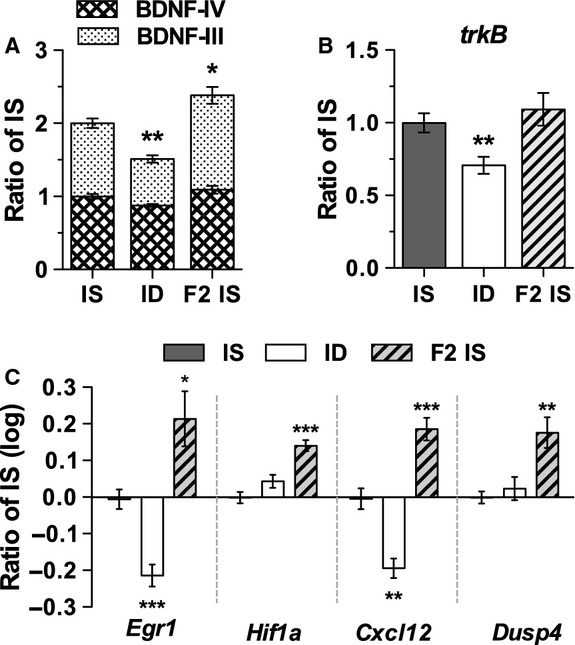
Figure 2.

Quantitative PCR (qPCR) analysis demonstrates increased expression of BDNF and downstream targets in the P15 F2 IS rats. Transcript levels were measured from the hippocampus of F1 iron sufficient (IS), F1 iron deficient (ID), and F2 iron-sufficient (F2 IS) rats for (A) BDNF-III and BDNF-IV, (B) trkB, and (C) Egr1, Hif1a, Cxcl12, and Dusp4. Values are means ± SEM; n = 4–6/group; *P < 0.05, **P < 0.01, and ***P < 0.001, Unpaired t-test.
