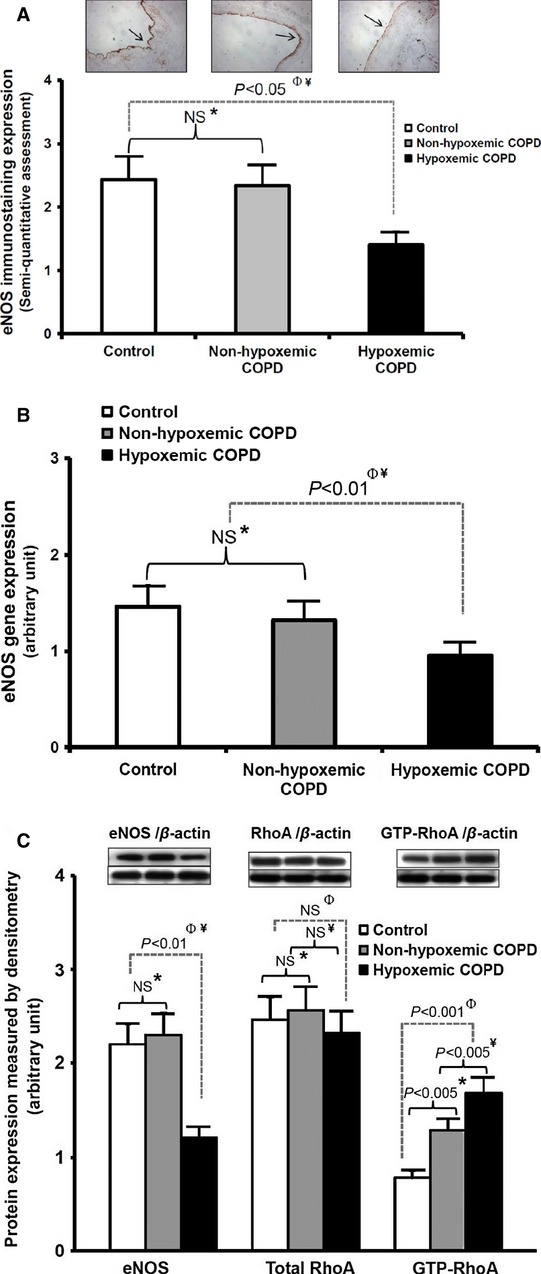
Figure 2.

(A) Reduced immunostaining expression of eNOS in pulmonary arteries from hypoxemic COPD patients. Images on top: eNOS immunostaining of proximal arterial rings with magnification ×5. *, control (n = 7) versus nonhypoxemic COPD (n = 7); Φ, control versus hypoxemic COPD (n = 6); ¥, nonhypoxemic COPD versus hypoxemic COPD; NS, no significant difference. (B) Reduced gene expression of eNOS measured by RT-PCR in pulmonary arteries from hypoxemic COPD patients. *, control (n = 7) versus nonhypoxemic COPD (n = 7); Φ, control versus hypoxemic COPD (n = 6); ¥, nonhypoxemic COPD versus hypoxemic COPD; NS, no significant difference. (C) Protein expression of eNOS, total RhoA, and GTP-RhoA in pulmonary arteries measured by Western blot and pull-down assay. *, control (n = 7) versus nonhypoxemic COPD (n = 7); Φ, control versus hypoxemic COPD (n = 6); ¥, nonhypoxemic COPD versus hypoxemic COPD; NS, no significant difference.
