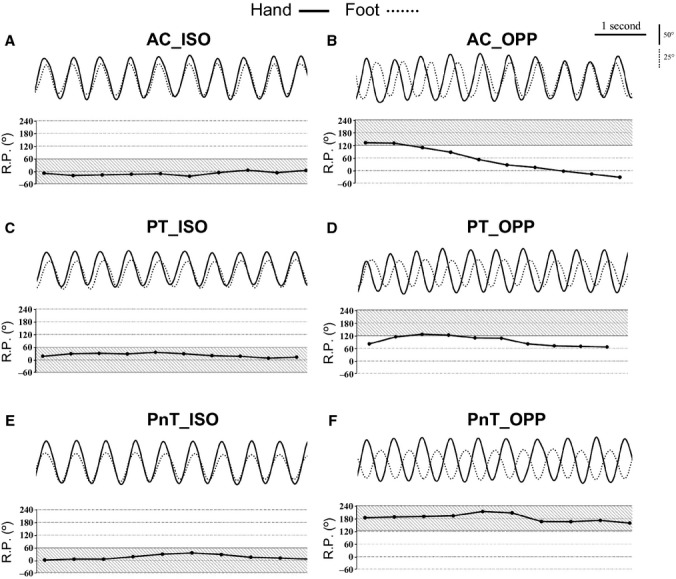
Figure 2.

Typical changes in wrist and ankle joint angles, and the relative phases between them in a trial involving AC(A and B), PT(C and D), and PnT tasks (E and F). Left figures indicate the same direction and right figures indicate opposite direction. The black solid and dashed lines show wrist and ankle angle, respectively. The lower graph in each figure shows the relative phase of wrist and ankle angles. The gray area indicates the success range in each condition (ISO, 0 ± 60°; OPP, 180 ± 60°). A–F are AC_ISO, AC_OPP, PT_ISO, PT_OPP, PnT_ISO, and PnT_OPP, respectively. AC, active coordination; PT, passive tracking; PnT, passive nontracking; ISO, the same direction; OPP, the opposite direction.
