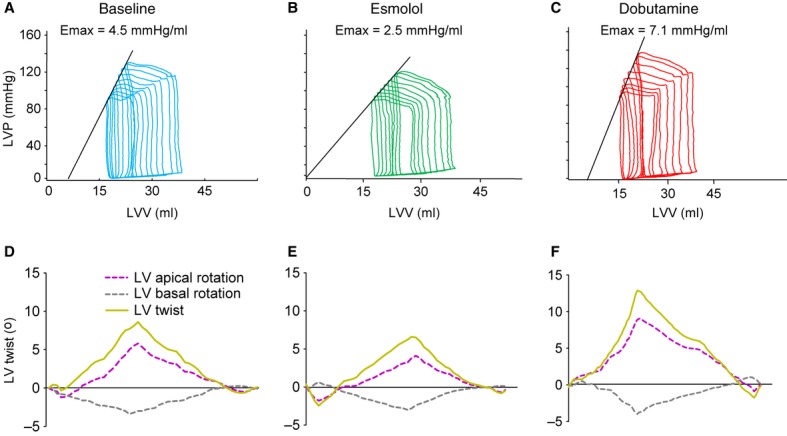
Figure 1.

Pressure–volume loops and STE parameters. (A–C) Typical pressure–volume loops were recorded from one animal under baseline conditions (left) and during infusion of esmolol (middle) and dobutamine (right). The Emax was calculated as the linear slope of end-systolic points from multiple loops obtained during IVC occlusion. Emax decreased with esmolol and increased with dobutamine. Two-dimensional STE was performed simultaneously and STE parameters were determined off line. (D–F) left ventricular twist is decreased from baseline with esmolol and increased with dobutamine.
