
Figure 5.
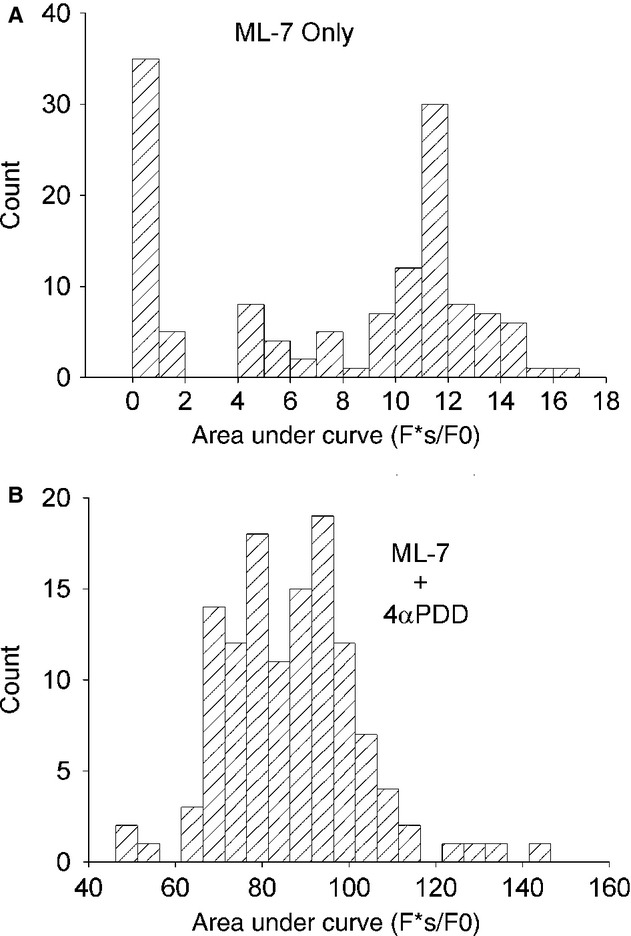
Histograms of individual ROI areas under the curve responses to treatment with (A) ML-7 alone (N = 272) and (B) ML-7 followed by 4αPDD (N = 466).
Official websites use .gov
A
.gov website belongs to an official
government organization in the United States.
Secure .gov websites use HTTPS
A lock (
) or https:// means you've safely
connected to the .gov website. Share sensitive
information only on official, secure websites.
Histograms of individual ROI areas under the curve responses to treatment with (A) ML-7 alone (N = 272) and (B) ML-7 followed by 4αPDD (N = 466).