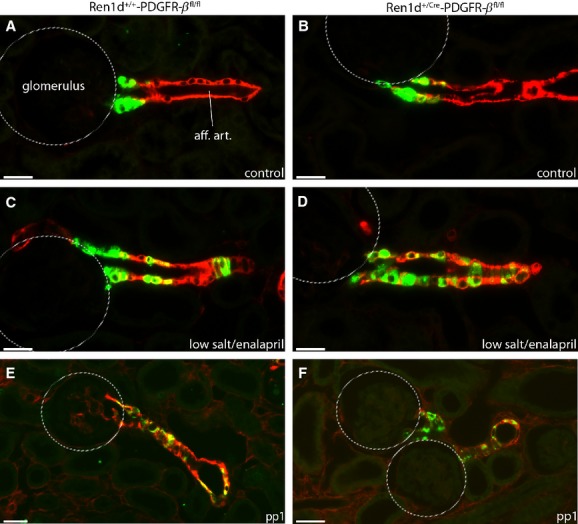
Figure 4.

Immunohistochemical localization of renin-producing cells in Ren1d+/+-PDGFR-βfl/fl and Ren1d+/Cre-PDGFR-βfl/fl mice. Renin (green) and α-SMA (red) immunoreactivity in adult kidney sections under control conditions (A. B), after treatment with low salt and enalapril (C, D) and at developmental stage pp1 (E, F). Yellow color indicates coexpression. Scale bar = 20 μm.
