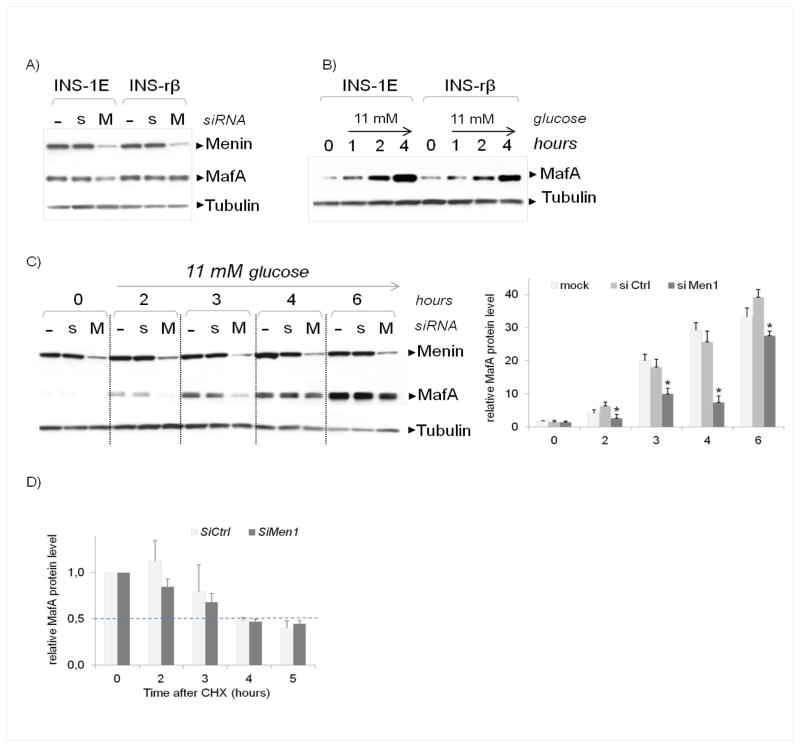
Figure 2. Effect of MENIN inhibition on MAFA protein levels and stability in cell lines.
(A) IB of MAFA expression in basal culture conditions: INS-1E and INS–rβ cells were transfected with either non-targeted (s) or anti-Men1 (M) siRNA pools or with transfection agent only (−), then maintained in 5 mM glucose medium and harvested 48 h after transfection. Each analysis was performed with 30 μg of total protein. Each membrane was cut in half at the 60-kDa ladder band; the upper section was used to detect MENIN, and the lower section was used to detect MAFA (between 45 and 55 kDa) and the loading control tubulin (around 55 kDa). The image is representative of at least four experiments. (B) IB of MAFA following acute glucose stimulation. Two days after seeding, the cells were starved overnight in 0.1 mM glucose and then stimulated with 11 mM glucose medium before being harvested at several time points. As mentioned in Fig. 2A, 30 μg total protein was analysed Lane 0: after overnight 0.1 mM glucose starvation before glucose stimulation. C) Left: IB of MAFA following MENIN inhibition and acute glucose stimulation. Two days after seeding, cells were transfected as described for Fig. 2A; after 36 h, they were starved overnight in 0.1 mM glucose and then stimulated in 11 mM glucose medium as described for Fig. 2B, before being harvested and analysed by IB as described above. The image is representative of at least four experiments. Right: Quantitative analysis was performed using Bio-Rad Quantity One software (version 4.6.7). The results represent the relative MAFA signal normalised to the tubulin signal at each time point. *p<0.05. (D) Effect of MENIN inhibition on MAFA protein stability. INS-1E cells were transfected as described above. After 48 h, cells were treated with CHX and harvested at the indicated time points before quantitative analysis of the IB was performed as described above. The results represent the MAFA signal normalised to the tubulin signal at each time point. To better visualise any differences or similarities, we arbitrarily set 1 as the value for MAFA mRNA level at T0 both in siCtrl and siMen1 conditions. The dotted lines represent half of the protein quantity. The experiments were repeated in triplicate.

