Figure 1.
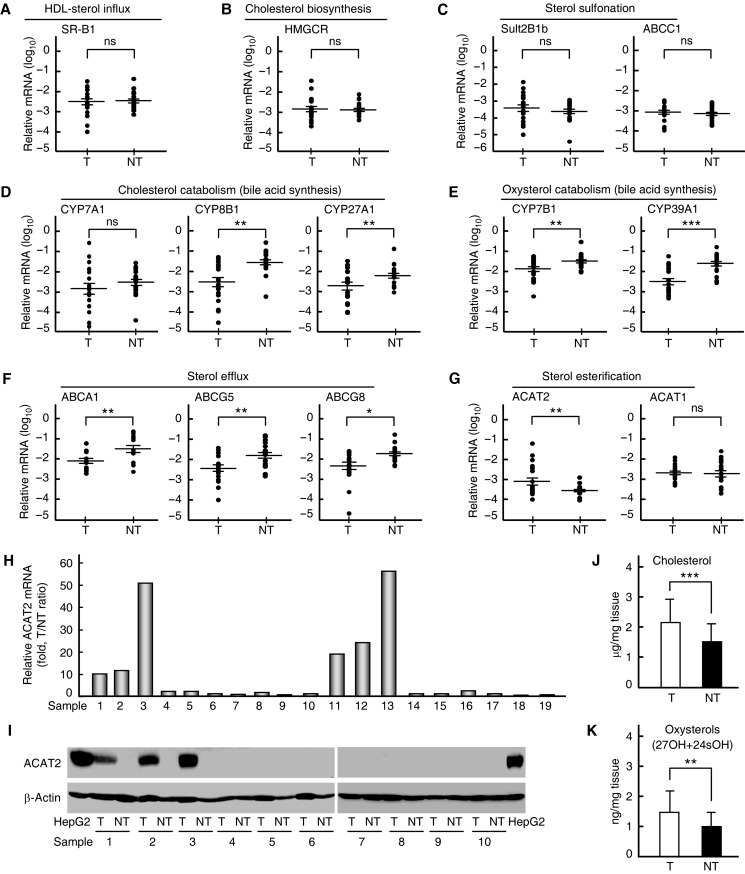
Determination of cholesterol metabolism-related gene expressions and sterols in human tissues. (A–G) Quantitative RT–PCR analysis of mRNA levels for cholesterol metabolism-related genes in 19 paired samples of human HCC tissues (T) and adjacent non-tumorous tissues (NT). Statistical analysis was performed with a two-tailed ratio t-test; data are shown as mean ± SEM after log transformation (n = 19). Each dot represents the mean of relative mRNA levels (log10) in triplicates for the indicated gene in each tissue sample. *P < 0.05, **P < 0.01, ***P < 0.001, ns, not significant. (H) Quantitative RT–PCR analysis of ACAT2 mRNA levels in 19 paired samples (1–19) of human T and NT. T/NT ratio of each pair of samples indicates relative ACAT2 mRNA level, expressed as fold changes, in each T sample. (I) Immunoblots of ACAT2 protein in 10 paired samples (1–10) of human T and NT. Data are representative of two independent experiments. (J and K) Cholesterol (J) and oxysterol (K) contents in 10 paired samples (1–10) of human T and NT. Statistical analysis was performed with a two-tailed paired t-test, and data are shown as mean ± SD (n = 10). **P < 0.01, ***P < 0.001.

