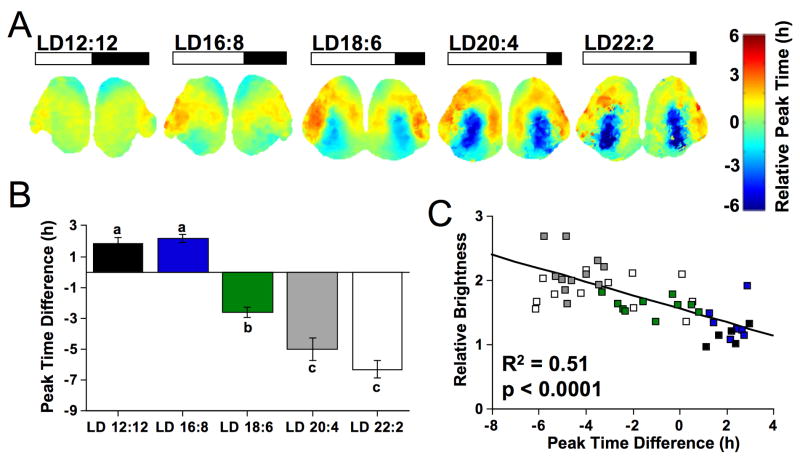
Figure 3. Photoperiodic changes in the organization and function of the SCN network.
A) Average phase maps illustrating SCN organization across a range of long day conditions (n =7–13/condition), with peak time relative to the field rhythm of the whole slice on the first cycle in vitro. B) The peak time difference between cSCN and dSCN regions increased with day length. Regions used for analyses as illustrated in Fig. 1D. Letters represent groups that differ significantly, ANOVA followed by Tukey’s honestly significant difference, p < 0.005. C) Total PER2::LUC expression within the cSCN (relative to the dSCN) over the first 24h in vitro correlates with the initial shell-core peak time difference. Symbol colors represent different day length conditions as indicated in B. See also Figure S3.

