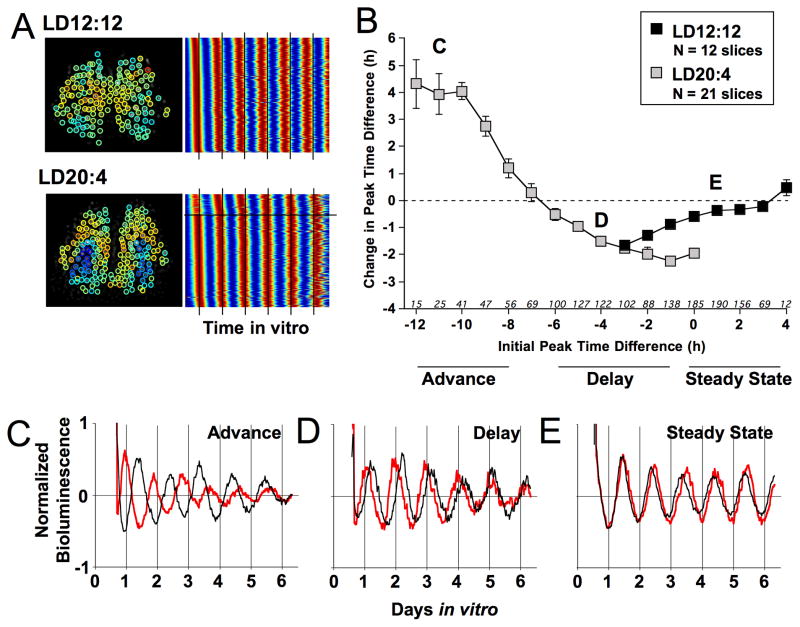
Figure 5. Phase-dependent changes in SCN organization over time in vitro.
A) Background-subtracted images of LD12:12 and LD20:4 slices illustrating cellular regions of interest (ROIs, with colored circle indicating cellular peak time relative to the field rhythm of the whole slice (color scale as in Fig. 1C), with heat-map style raster plots illustrating PER2::LUC rhythms from all cell-like ROIs extracted from each slices (high and low PER2::LUC expression indicated by red and blue, respectively). LD12:12 neurons display stable phase relationships over time in vitro, as evident by the stability of peak times relative to the line superimposed at 24h intervals. In contrast, LD20:4 neurons display larger initial differences in peak time, which diminish over time in vitro. Note that the horizontal line within the LD20:4 record separates data from core and shell neurons. B) Coupling response curve for SCN cells constructed with a 2h running average. Initial peak time difference was defined on the second cycle in vitro, with change quantified over the subsequent two cycles in vitro. According to convention, phase advances and delays are positive and negative values, respectively. Letters superimposed onto specific points of the coupling response curve correspond to representative cell data below. Italicized numbers along abscissa indicate number of core cell-like ROIs within each bin (LD20:4 sample size for initial phase difference of −3 to 0: 99, 70, 42, 12). C–E) PER2::LUC time series for representative dSCN (black) and cSCN cell-like ROIs (red) illustrating dynamic changes over time in vitro. After LD20:4, cSCN cell-like ROIs displayed either phase advances (C) or phase delays (D). Note that the SCN core cell moves toward a more typical phase relation with the SCN shell cell in both the advance and delay direction, with stable realignment occurring within the recording interval for the latter. After LD12:12, the peak time difference between dSCN and cSCN cell-like ROIs is small and relatively stable (E). See also Figure S5.

