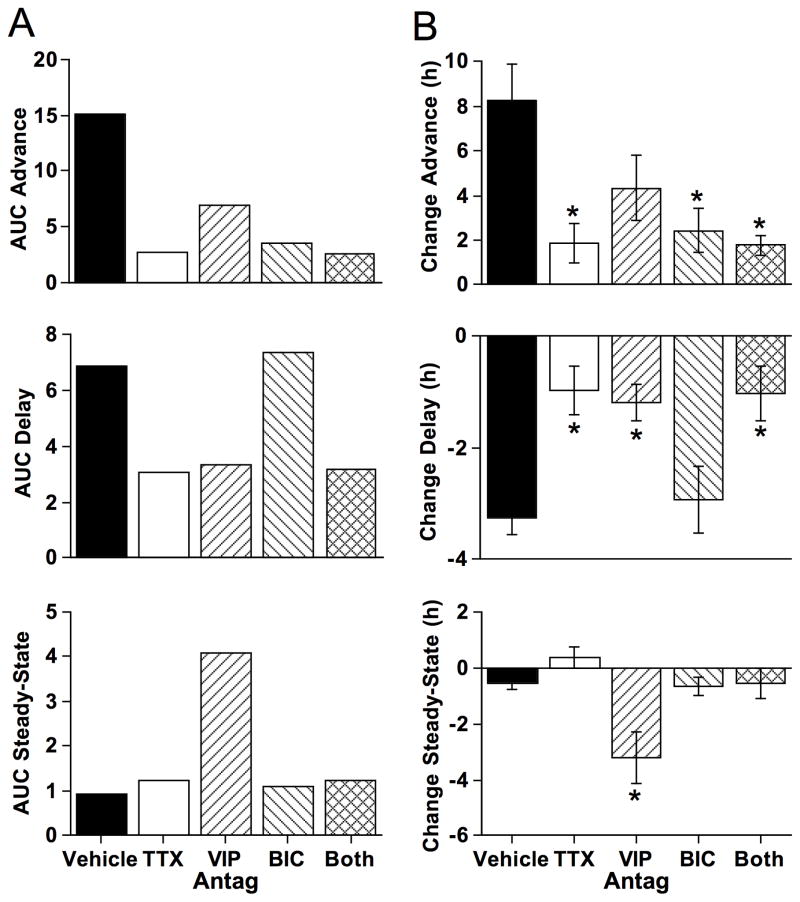
Figure 7. Pharmacological manipulation of SCN coupling responses.
A) Area under the curve (AUC) for the advance, delay, and steady-state regions (as defined below the abscissa in Fig. 5B). B) Differential effects of different pharmacological agents on resynchronization and maintenance of steady-state phase relationships. Effects of pharmacological manipulations were compared using cellular data within the advance portion of the curve (all cells with an initial peak time difference between −11 and −12) delay portion of the curve (all cells with an initial peak time difference between −4 and −3), and steady-state portion of the curve (all cells with an initial peak time difference between +2 and +3). Sample sizes for each group are indicated along the abscissa of Figure 5B and Figure 6A–D. * Full Factorial ANOVA followed by post hoc Student’s t test with Bonferroni correction, p < 0.01.

