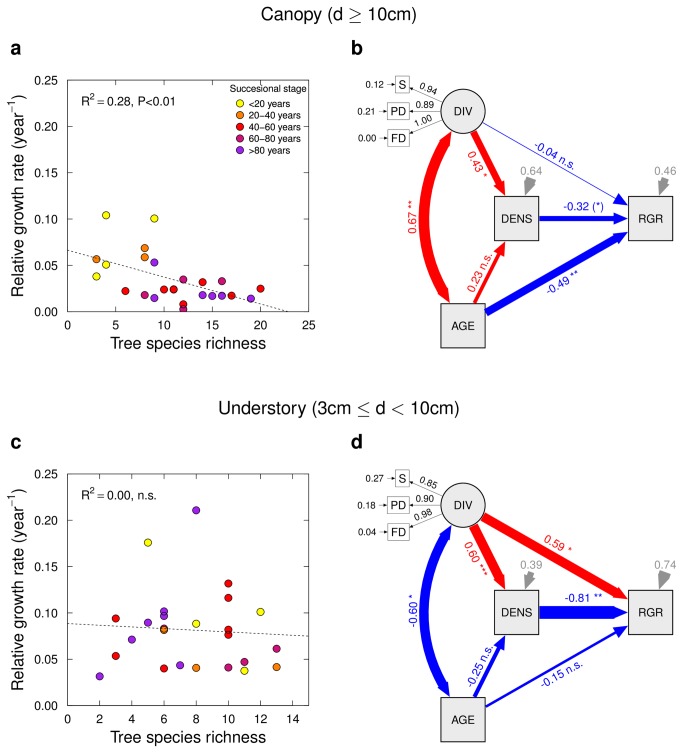
Figure 3. Relative growth rate of individual stem basal area (RGR, 2008–2010 period) in dependence of successional age, tree species richness, and tree stem density.
In the canopy tree (d>10 cm) cohort, RGR declines with diversity (a) due to its correlation with successional age (b; path from DIV via AGE to RGR); in the understory (3 cm<d<10 cm) cohort, a positive direct and negative indirect (via density) effect of species richness on RGR balance each other out (c, d). The diagram shows standardized path coefficients (red: positive; blue: negative) and associated statistical significances (*** P<0.001; ** P<0.01; * P<0.05; (*) P<0.1). Variable abbreviations: S = species richness, PD = phylogenetic diversity, FD = functional diversity, DIV = diversity (latent variable related to previous three), AGE = successional age, DENS = tree density, BA = total stem basal area, ∆BA = increment of total stem basal area.

