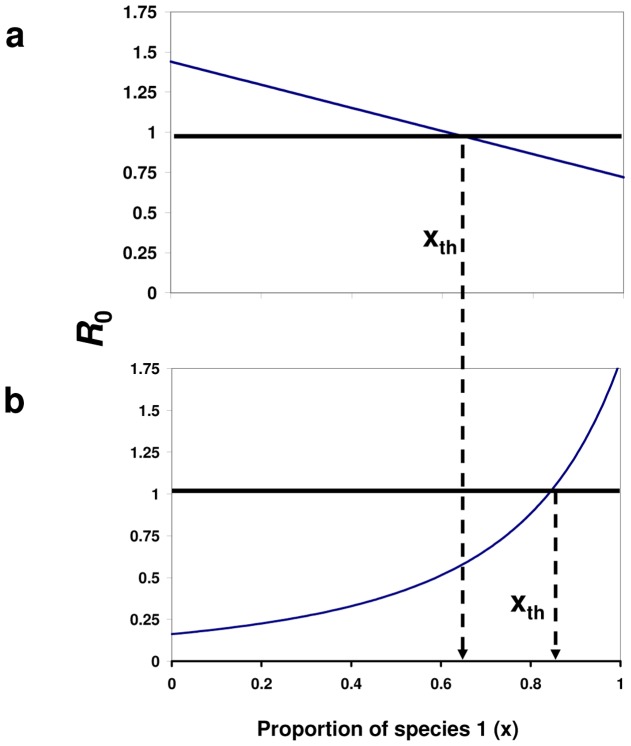
Figure 1. Dilution - R 0(x) is monotonic as a function of host diversity.
The figure depicts R0 as a function of x, the proportion of host species 1 in the community. The behavior of R 0(x) depends on the values of the vector preference, α, and the transmission ratio, γ. Panels a and b exemplify two cases of monotonic dependency of R0(x): (a) α = 1 and γ = 2, i.e., there is no vector preference and species 2 is a better transmitter. In this case R0 linearly decreases with an increase in the proportion of species 1, x (the inferior transmitter). In this simulation the vector and the total host densities are V = 100 and N = 2500, respectively. (b) α = 3 and γ = 0.09<1/α2, i.e., There is preference towards species 2 and species 1 is the better transmitter. R0 increases with the proportion of species 1 in a nonlinear way. In this simulation the vectors and the total host densities are V = 100 and N = 1000, respectively. Disease eruption is possible only if R0>1, i.e., the proportion of species 2 should be above xth = 0.37 in figure 1a and the proportion of species 1 should be above xth = 0.84 in figure 1b. Additional parameter values of both figures are: g1 = 0.01, k = 3, and d = 0.05.

