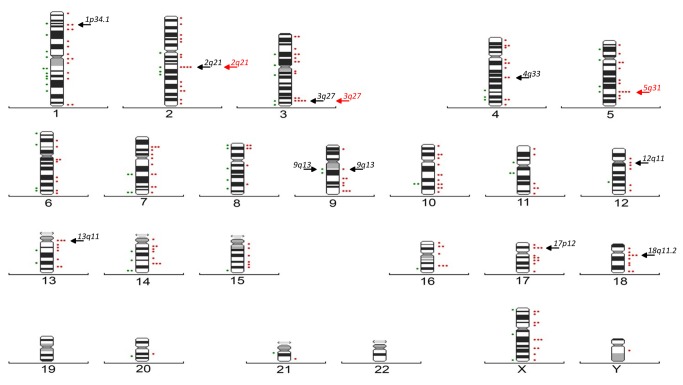
Figure 1. Distribution of chromosome breakpoints observed in exposed (right) and non-exposed individuals (left) in the human ideogram (400-band resolution).
The most affected bands using the FSM statistical method are indicated by red arrows, and when using another statistical method that takes into account the relative length of chromosomal bands, by black arrows.

