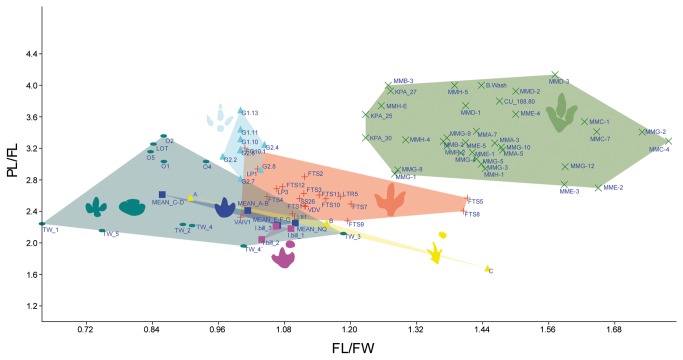
Figure 12. Bivariate analysis of the FL/FW ratio and PL/FL ratio of I?oncalensis, T. pandemicus and other ornithopod ichnotaxa.
Plot showing the bivariate analysis results with FL/FW on the X axis and PL/FL on the Y axis. T. pandemicus (green), I? oncalensis (red), Dineichnus (light blue), Iguanodontipus billsarjeanti (pink), Iguanodontipus burreyi (dark blue), Ornithopodichnus (greenish blue), Neoanomoepus (yellow).

