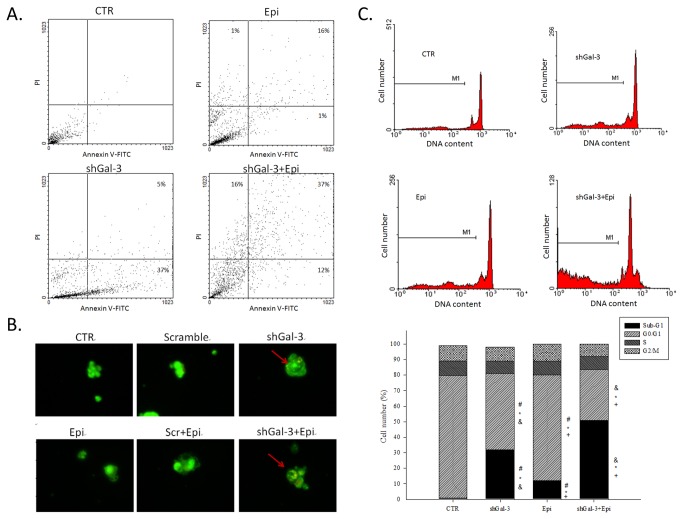
Figure 2. Epirubicin treatment induces apoptosis in galectin-3 knockdown calls.
Cells were treated with medium, Epi, and/or shGal-3 for 48 h. (A) Cell apoptosis was then analyzed with a flow cytometer using annexin V/PI staining methods. The data are representative of three independent experiments and the numbers in the respective quadrants indicate the percentage of cells present in this area. (B) The cells were visualized with an inverted microscope equipped with a fluorescence image acridine orange. (C) Cell cycle was analyzed using flow cytometry. M1 represents the ratio of the number of cells in sub-G1 population to the number of total cells. The means ± SD from four independent measurements are shown. *, P < 0.05 compared with the control (CTR); +, P < 0.05 compared with shGal-3; &, P < 0.05 compared with Epi.

