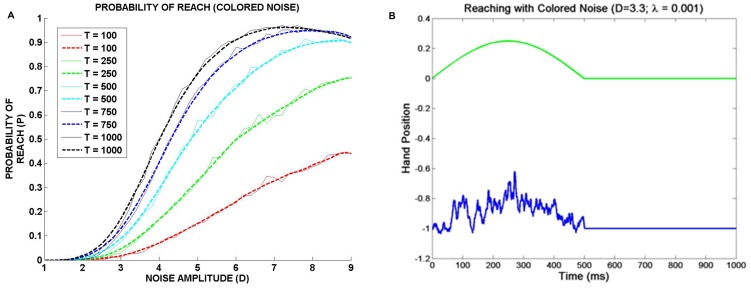
Figure 6. Reaching with colored noise.
(a) Plots of probability of reach (P) vs. noise amplitude (D) for colored noise for various values of T ( = 100, 250, 500, 750, 1000). Corresponding to each value of T, there is a thin solid line and a thick dashed line. The solid line represents the original simulation result, and the dashed line is the smoother version of the same. A 0 = 0.25. λ = 0.001. (b) An instance of reaching under colored noise conditions. λ = 0.001, D = 3.3, A 0 = 0.25, T = 1000.

