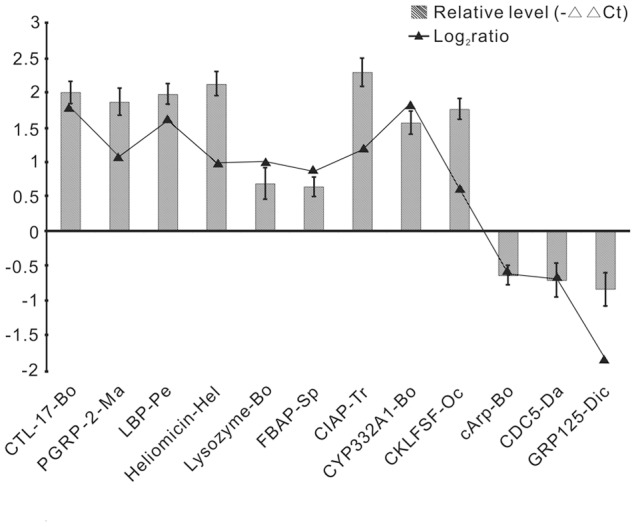
Figure 11. qPCR validation of the selected DEGs.

The y-axis indicates the value of relative expression level (2−△△Ct) by qPCR and log2 Ratio of TT01/PBS by deep sequencing.

The y-axis indicates the value of relative expression level (2−△△Ct) by qPCR and log2 Ratio of TT01/PBS by deep sequencing.