
Figure 11. qPCR validation of the selected DEGs.
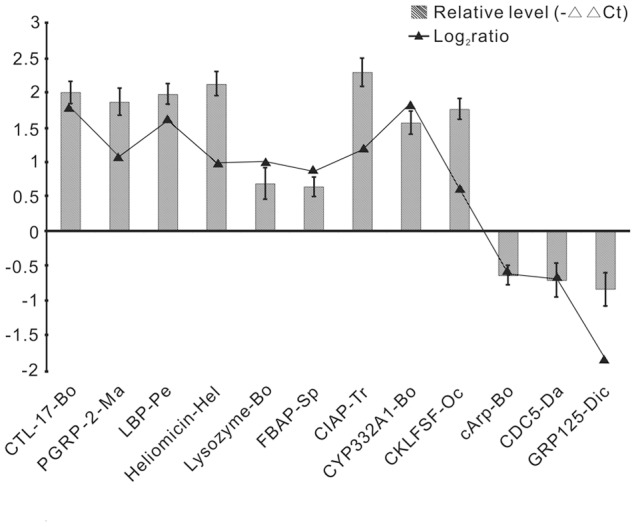
The y-axis indicates the value of relative expression level (2−△△Ct) by qPCR and log2 Ratio of TT01/PBS by deep sequencing.
Official websites use .gov
A
.gov website belongs to an official
government organization in the United States.
Secure .gov websites use HTTPS
A lock (
) or https:// means you've safely
connected to the .gov website. Share sensitive
information only on official, secure websites.
The y-axis indicates the value of relative expression level (2−△△Ct) by qPCR and log2 Ratio of TT01/PBS by deep sequencing.