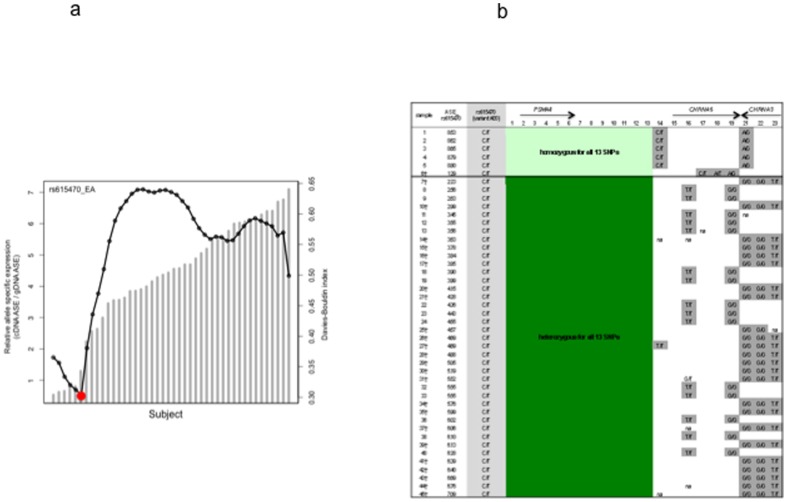
Figure 3. Allele specific expression (ASE) analysis with rs615470 in 45 frontal cortices of European ancestry.
3a. Davies-Bouldin (DB) validity index analysis. Columns represent the ASE. Dotted line represents the DB validity index. The red dot indicates the optimal cutoff predicted by the DB index that coincides with ASE. 3b. Concordance of allelic expression variation with heterozygosity. Samples #1 to #6 which show relative allelic expression balance (*ASE<2) are homozygous for the 13 highlighted SNPs. Samples #7 to #45 which showed relative allelic expression imbalance are heterozygous for all 13 SNPs. *See material and method for details; ASE: allele specific expression. † Indicates samples are also heterozygous for rs16969968.

