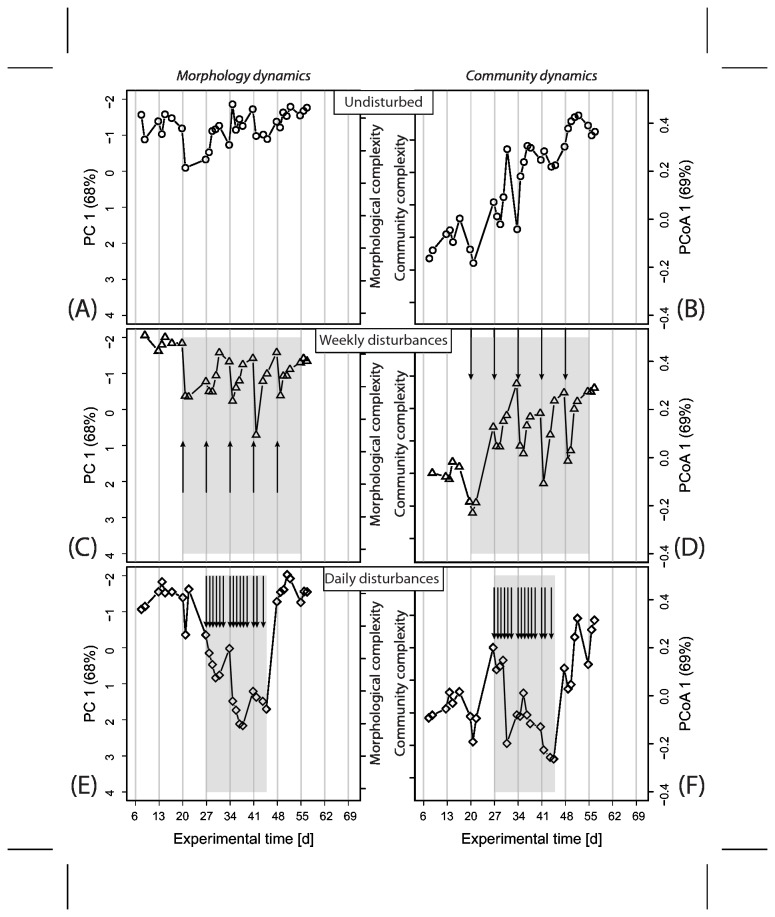
Figure 3. Morphology and community development with experimental time for the three reactors in the first experiment.
The data for the second experiment can be found in Figure S6. Treatment periods were shaded where appropriate (panels C-F). Each monochloramine pulse injection is indicated by an arrow. Vertical gray lines mark Mondays. By performing Principal Component and Principal Coordinate Analyses, most of the variability in the data sets could be summarized in the first Principal Component (PC1) for morphology data and the first Principal Co-ordinate Axis (PCoA1) for the community data. More negative values on PC1 (note inverted axis labels) were related to more complex biofilm morphology. Similarly, the higher the value on PCoA1, the more complex was the community structure. Note the inverted axis in panels Figure 3 and S6A, C and E.

