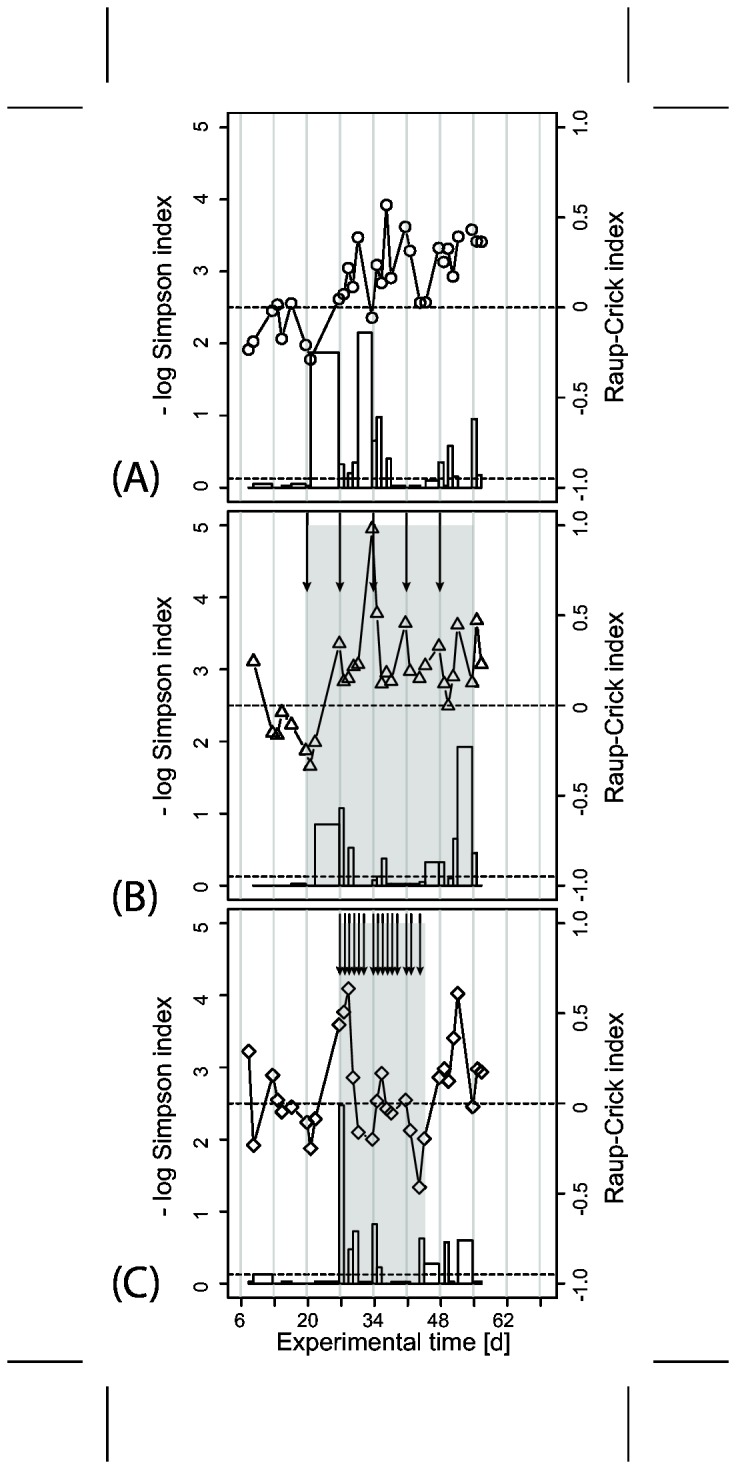
Figure 5. Development of bacterial diversity over time.

We used the – log Simpson diversity index for individual molecular fingerprints and the Raup-Crick index to compare the composition (presence-absence of peaks) in a moving window of two subsequent samples from the same reactor. The solid lines with symbols represent – log Simpson diversity. The height of bars indicates the value of the Raup-Crick index for the comparison of the two samples at the left and right edge of the bars. Bar width stands for time between two samples and may vary. Raup-Crick values smaller than -0.95 indicate significantly more similar community compositions than expected from a random draw. Values around 0 indicate that observed differences could be explained by random effects while values greater than 0.95 indicate significant dissimilarities in composition. Shaded areas and arrows show treatment periods and monochloramine pulse injections. Dashed lines are the -0.95 and 0 levels for the Raup-Crick index.
