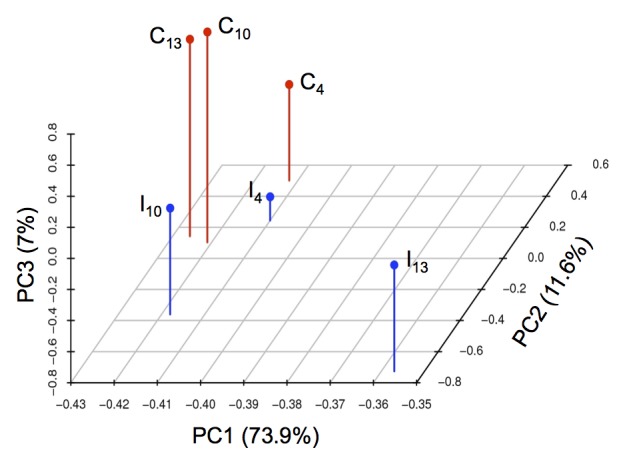
Figure 3. Principal component analysis of the transcriptome data.

Principal components (PCs) 1, 2 and 3 account for 73.9, 11.6 and 7% of the variance, respectively. C4, control at 4 dai; C10, control at 10 dai; C13, control at 13 dai; I4, S. tritici-infected wheat at 4 dai; I10, S. tritici-infected wheat at 10 dai; I13, S. tritici-infected wheat at 13 dai.
