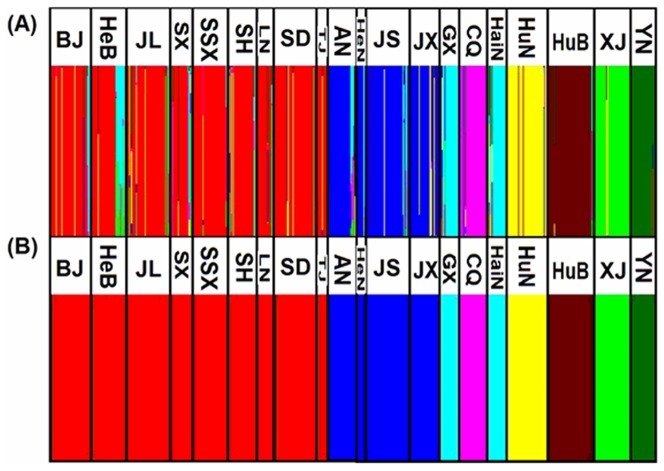
Figure 2. Bayesian individual clustering and Bayesian population clustering for the microsatellite data set of B. tabaci Q in China.
In both A and B, individuals are grouped by sampling location. Abbreviations shown at the top of panels A and B are code names of sampling locations as indicated in Figure 1. (A) Each individual is represented by a vertical bar partitioned into colored segments using BAPS. (B) Delineation of eight genetic clusters using BAPS. Each color indicates sampling localities belonging to each cluster.

