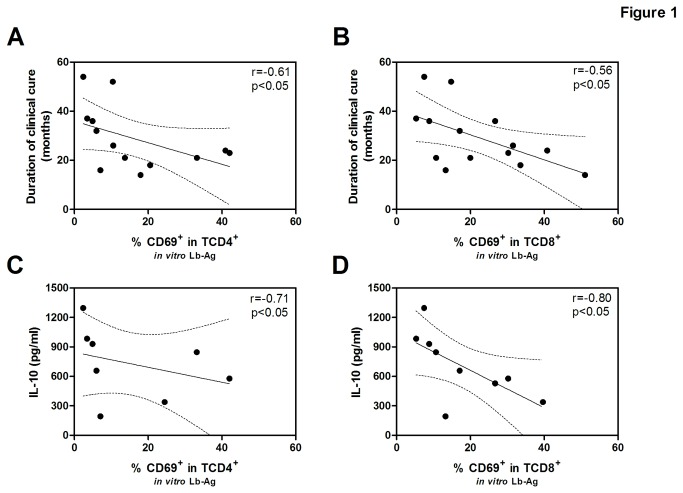
Figure 1. Correlation analysis of clinical and/or immunological parameters from healed cutaneous leishmaniasis subjects.
Correlation between the percentage of recently activated CD4+ (A, n=13) or CD8+ (B, n=14) T lymphocytes from PBMC after in vitro Lb-Ag stimulation and the duration of clinical cure; Correlation between the percentage of activated CD4+ (C, n=8) or CD8+ (D, n=9) T lymphocytes and the concentration of IL-10 from cell culture supernatant; Each point represents one subject. The graphs show the best fitted lines with 95% confidence intervals. r= correlation coefficient; p= significance level, (Spearman test).

