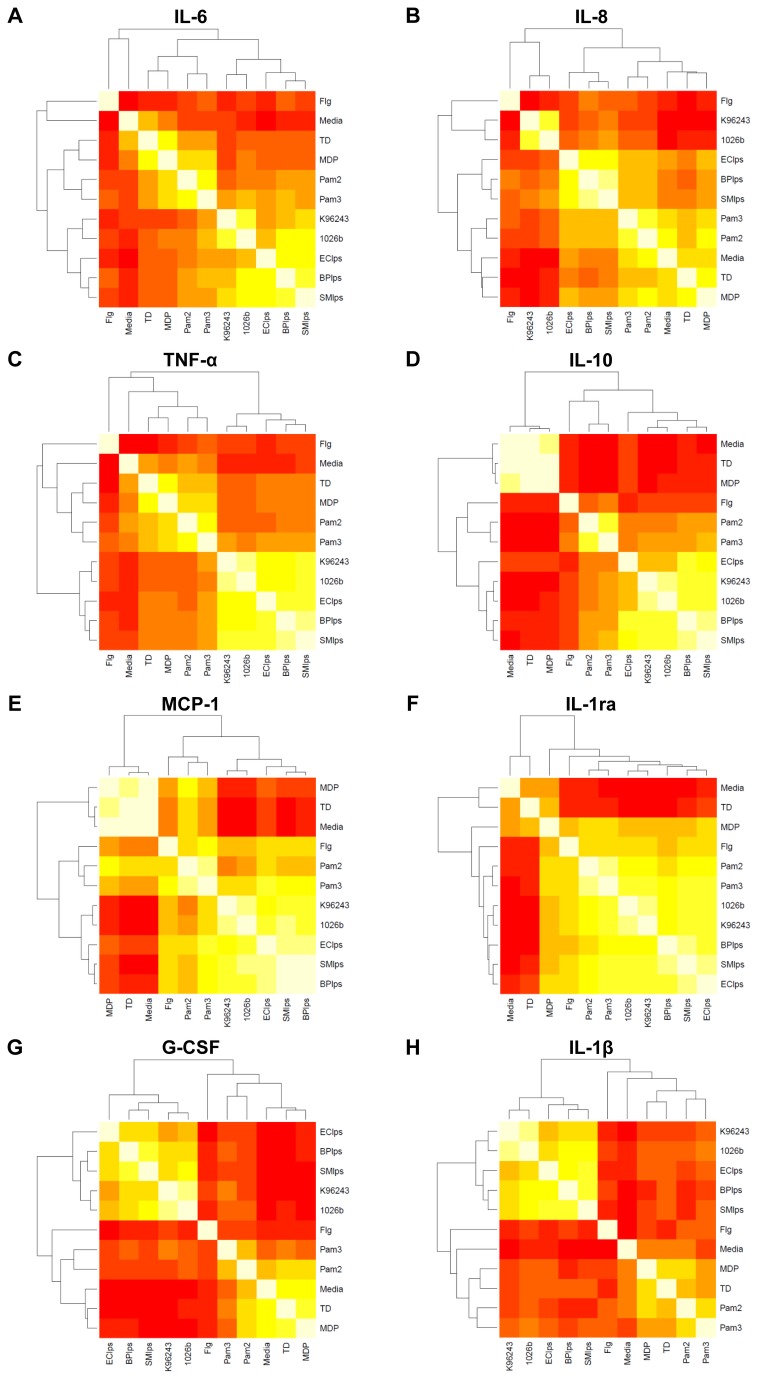
Figure 3. Heat map of correlation between cytokine concentration induced by stimulation of whole blood with a panel of purified innate immune ligands and heat-killed bacteria (as specified in the methods) with dendrogram of hierarchichal clustering results for the correlation matrix.
Lowest correlation is red and highest correlation is white.

