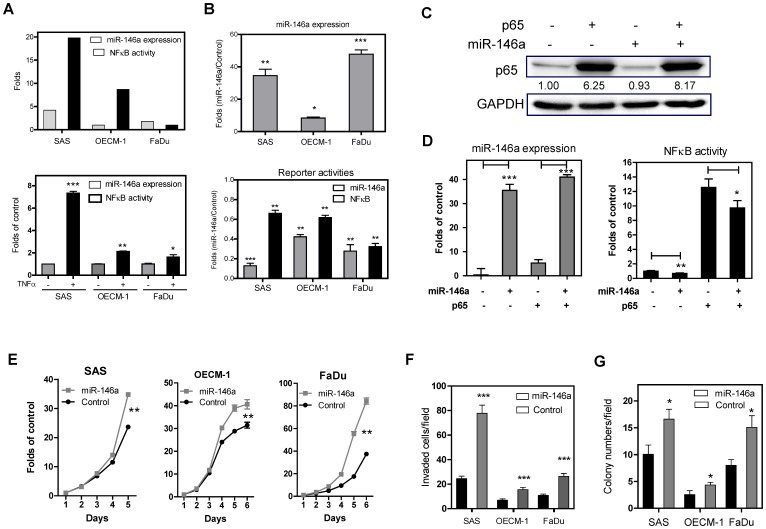
Figure 2. Exogenous miR-146a expression enhances OSCC oncogenicity.
(A) Upper, The OSCC cells have various endogenous levels of miR-146a expression (the level of OECM-1 cells serves as baseline) and of NFκB activity (the level of FaDu cells serves as baseline). Lower, TNFα treatment up-regulates miR-146a expression in OSCC cells. (B) The OSCC cell subclones show an increase in miR-146a expression (Upper), an increase in miR-146a activity and a decrease in NFκB activity (Lower). (C, D) Exogenous p65 expression in SAS cell subclones. (C) Western blot analysis showing exogenous p65 expression after transfection. (D) miR-146a expression (Lt) and NFκB activity (Rt). The analysis shows that miR-146a expression only slightly down-regulates endogenous or exogenous NFκB activity. The fold changes in (D) are determined by normalization against the control cells transfected with empty vector. (E - G) Proliferation assay, invasion assay and AIG analysis performed on the OSCC cell subclones. Exogenous miR-146a expression in OSCC cells increases these oncogenic phenotypes to different extents. The folds in (E) are defined by normalization against the cell numbers at different time points relative to the numbers of cell seeded. Data are shown as mean ± SE from at least triplicate analyses. (C) is a representative picture of three individual experiments and the numbers are the normalized values. *, p<0.05; **, p<0.01; ***, p<0.001; Mann-Whitney test or Two-Way ANOVA test.

