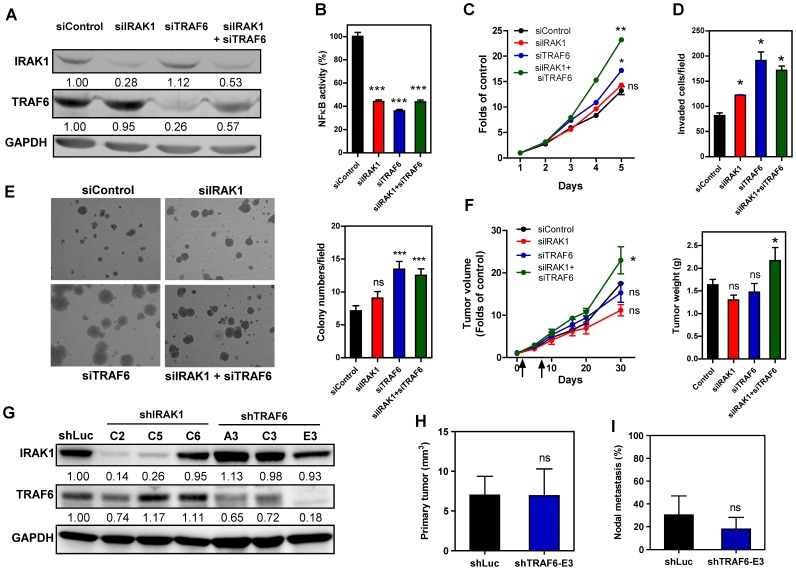
Figure 8. Knockdown of IRAK1 and TRAF6 increases SAS cell oncogenicity.
(A–F) Transient knockdown of gene expression using small interference oligonucleotides. (G–I) Stable knockdown of gene expression using shRNA constructs. (A, G) Western blot analysis of IRAK1 and TRAF6 to reveal the knockdown effect. (A) A decrease in IRAK1 and TRAF6 expression is found following treatment with siIRAK1 and/or siTRAF6 oligonucleotides. (B) NFκB activity assay. This shows that NFκB activity is decreased following knockdown of IRAK1 and/or TRAF6. (C – E) Knockdown of IRAK1 and TRAF6 increases the proliferation, invasion and AIG of SAS cells. (E, Lt), inverted microscopy images of colonies; (E, Rt) quantification of colonies. (F) Knockdown of IRAK1 and/or TRAF6 for subcutaneous tumorigenesis. Lt, growth curve. Combined treatment with both siIRAK1 and siTRAF6 significantly increases the xenografic growth of SAS cells. Rt, quantification of the weight of the resected tumors. Arrows indicate time points for oligonucleotide injection. (G) Various shRNA constructs mediate different efficiencies in knocking down IRAK1 or TRAF6 expression in SAS cell subclones. shLuc, control subclone. shTRAF6-E3 subclone and control subclone are subjected to orthotopic tumorigenesis and nodal metastasis assays. (H, I) Volume of orthotopic tumor and rate of nodal metastasis, respectively. Numbers in (A, G) are normalized values. Data shown are the means ± SE from at least triplicate analysis or six mice. ns, not significant; *, p<0.05; **, p<0.01; ***, p<0.001; Mann-Whitney test or Two-Way ANOVA test.

