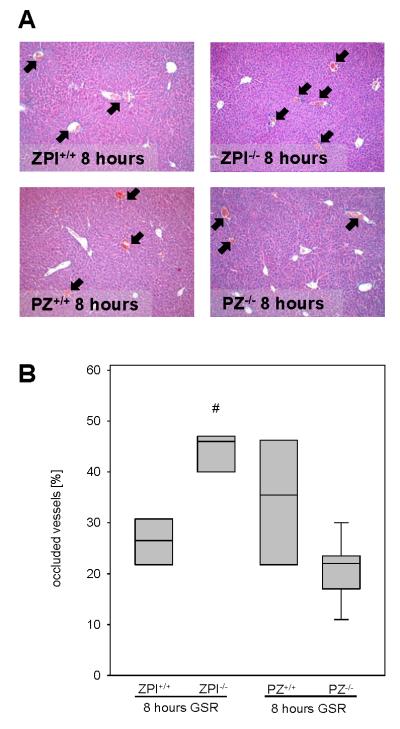
Figure 4. Analysis of thrombus formation in HE-stained liver tissue.

Representative images (A; original magnification ×100) display the magnitude of thrombus formation in liver tissue upon 8 hours of GSR (arrows). Thrombus formation is quantified as the fraction of occluded vessels in [%] of all vessels observed (B). Data are given as box plots indicating the median with the 25th and 75th percentiles. Mann-Whitney rank-sum test, followed by Bonferroni correction; # p<0.05 vs. wild-type GSR mice. Abbreviations: PZ, protein Z; ZPI, protein Z-dependent protease-inhibitor; GSR, generalized Shwartzman reaction; (GSR 8 hours: ZPI+/+ n=6, ZPI−/− n=7, PZ+/+ n=5, PZ−/− n=9).
