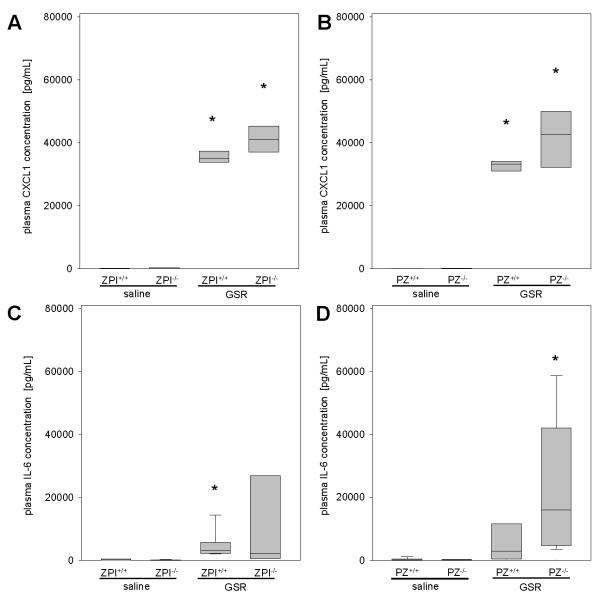
Figure 5. Analysis of pro-inflammatory cytokines.
Plasma CXCL1 (A, B) and IL-6 concentrations (C, D) are quantified for ZPI or PZ mouse strains upon induction of GSR or exposure to physiological saline. Data are given as box plots indicating the median with the 25th and 75th percentiles. Mann-Whitney rank-sum test, followed by Bonferroni correction; * p<0.05 vs. saline-treated mice with the same genetic background. Abbreviations: PZ, protein Z; ZPI, protein Z-dependent protease-inhibitor; GSR, generalized Shwartzman reaction; IL-6, terleukin-6; CXCL1, chemokine (C-X-C motif) ligand 1. (GSR 4 hours: ZPI+/+ n=11, ZPI−/− n=14, PZ+/+ n=11, PZ−/− n=14; saline: ZPI+/+ n=11, ZPI−/− n=13, PZ+/+ n=12, PZ−/− n=12).

